RBH transducer measurements 10/28/97
The setup
The set up was 4 RBH transducers sandwiched between the couch and the floor
powered by a 150W amp with the crossover set to both 40Hz and 80Hz.
A function generator was the signal source and was set to: .5 Vpp sine wave
output. The noise floor of the room was around 50 dB SPL C. A fan was
blowing on the amp inorder to keep it cool and linear.
My newest Radio Shack 33-2050 sound level meter (the one with the word Radio
Shack on it) was used. It was placed on the center cushion right where a
persons butt would typically be. Because of its coupling to the leather
couch its measurements are a combination of air vibration and mechanical
couch vibration. A junky analog volt meter set to AC and clipped on to the
speaker terminals was used for the voltage measurements.
EQ table
| curve |
25Hz |
31Hz |
40Hz |
50Hz |
62Hz |
80Hz |
| EQ1 (dB) |
+6 |
+6 |
-12 |
-12 |
+4 |
0 |
| EQ2 (dB) |
+8 |
+12 |
-12 |
-12 |
+12 |
+6 |
| EQ3 (dB) |
+8 |
+12 |
-12 |
-12 |
+12 |
+4 |
| EQ1+2 (dB) |
+14 |
+18 |
-24 |
-24 |
+16 |
+6 |
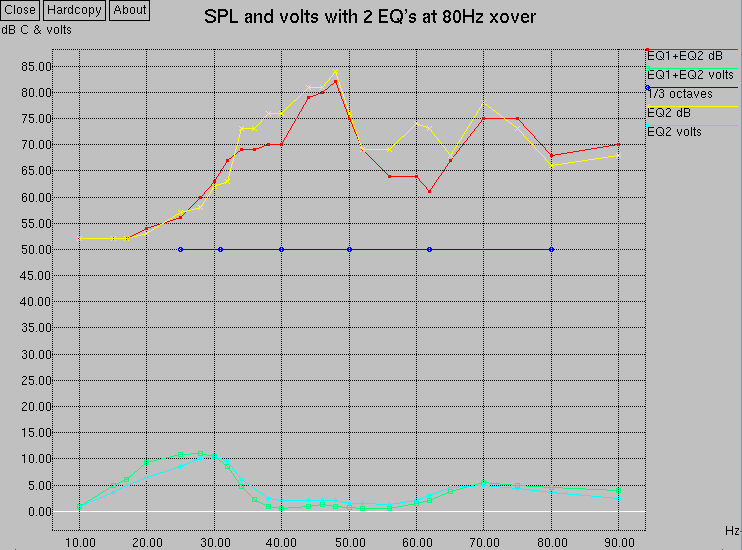
Plots comparing two different EQ curves and the voltage supplied by the
150watt amplifier. The purpose of this experiment was to increase dynamic
headroom by minimizing the EQ'ing at the extremes (dropping 25Hz and 80Hz
sliders). This didn't hurt sound/tactile quality much. Note that about a
little more that 10V is being driven at 30Hz. Assuming the 4 transducers are
wired such that the impedence is 4 ohms. Then P = e^2 / I, watts = 10^2 / 4,
watts = 25. So if the amp can generate 150 watts then these tests were
operated with 7.5 dB of headroom or max SPL peaks in the 90dB SPL C range.
I should run an experiment to measure this.

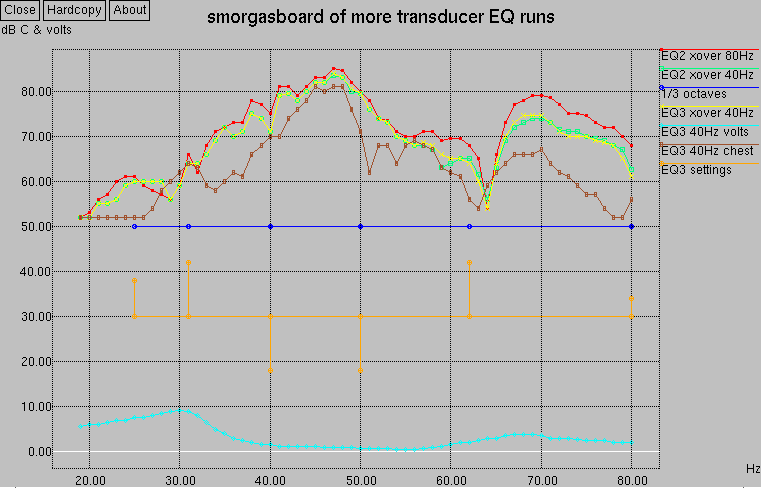
Many interesting thing are on this graph. I show the effects of changing the
crossover from 80Hz to 40Hz. Notice the high end (65Hz+) roll off.
Also a plot of chest (gut) SPL readings for comparison and a plot of
EQ3 voltage driven versus frequency. The smoother hump at 30Hz is eating
approximately 18dB of dynamic headroom. You get a 6dB drop in output for
every halving of the voltage.

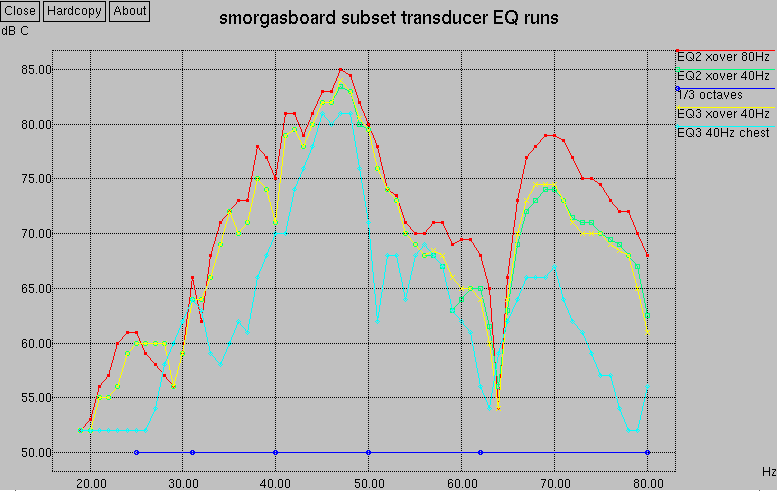
Here is a substet of the above plot that enhances the SPL view by eliminating
the voltage from the plot.

Check out my quest for bass page.


