|
|
|
histogram |
 The histogram display shows the probability distribution of the waveform's
sample amplitudes. This is known as the Probability Density Function
(PDF). To open the histogram window select the histogram option in the
displays sub section
of the main window.
The histogram display shows the probability distribution of the waveform's
sample amplitudes. This is known as the Probability Density Function
(PDF). To open the histogram window select the histogram option in the
displays sub section
of the main window.
Click the thumbnail below for a larger image.

The popup menu on the right is accessed by holding down the third mouse button
while in the histogram window. Through this menu manual clearing,
pasting, channel enabling, bin resolution, and amplitude zooming can be
performed.
Clear
Hitting clear or pressing the Delete keyboard
button will manually clear and reset all of the histogram bins to zero.
Paste
To view the probability distribution just select a block of
data from either the spectrogram or the waveform window and
paste it into the histogram. If no data is selected then the entire
data buffer is used. Pressing the Paste menu button or the second mouse
button anywhere in the histogram window will perform the paste operation, this
is the X-Window standard copy and paste method. Note that pasting can
only be done while in pause mode. When in record mode the input stream
automatically feeds the histogram window when it is either open or iconified.
When closed the histogram window does not accumulate data.
 channel
This selects which channels should be enabled for viewing. The default
is to view all channels. Note the
channels need to be mapped
and they need to be enabled in this menu before anything is displayed.
The intended use of this menu is to reduce the number of displayed histogram
channels for aesthetic or duplicate reasons.
amp scaling
This is a zoom factor into the vertical axis of bin fullness which is the same
as the number of hits that have been counted. Zoom all the way in
(Alt+Up) to see small details or zoom all the way out (Alt+Down) to see the
entire range (maximum number of hits down to zero hits) on the screen all at
once.
 # bins
This menu specifies how many bins of detail should be displayed. Normal
16 bit waveform data has an amplitude probability domain space of 65536
possible values. This is like a zoom factor on the sample amplitude
axis.
 decay
decay
The histogram bins can be set to decay while baudline is in the record
mode. This adds the dimension of time to the histogram display. A
sample probability distribution can change shape and track short term
transient events or general longer trends all in real-time.
The off duration is the default infinite accumulate setting.
Selectable durations range from 25 ms to 24 hours. This feature is
implemented as a sliding average function and the higher duration settings
may be grayed out since they are dependent on the amount of buffer space
allocated in the scroll control
window. Bigger buffer means a longer decay duration is possible.
Note the Pause mode operation of pasting samples into the Histogram
window is an infinite accumulate function. It works the same regardless
of the decay setting. Decay histogram only works while in the Record mode.
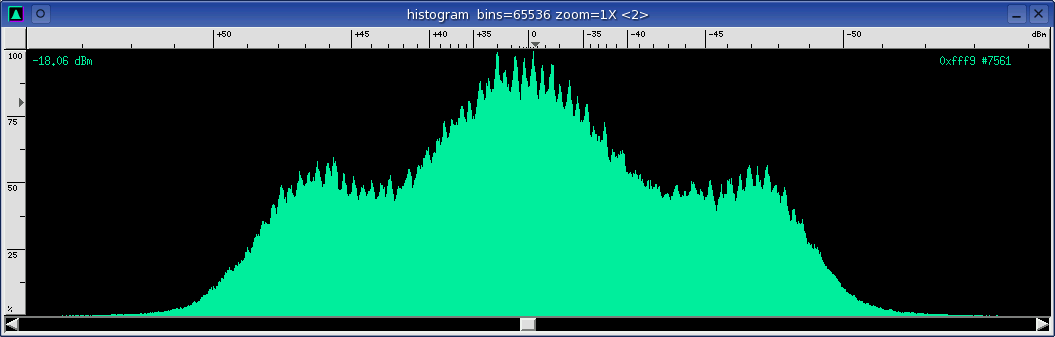
Below is the histogram plot of white Gaussian noise:
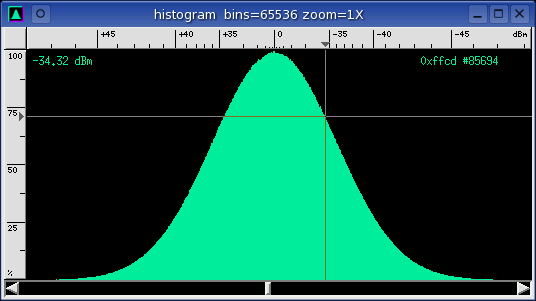
title bar
The bin and amplitude zoom factors are shown.
ruler
The horizontal axis on the top ruler is the same dBm scale that is used in the
waveform window. The unit dBm ranges from +90 dBm, the maximum
sample amplitude in 16 bit linear coding space, to -90 dBm, the most negative
sample amplitude, with 0 dBm being the origin in the middle. The vertical axis
on the left ruler is the count of the number of hits. The units are
percent, where 100% is the value of the highest bin and 0% means no hits.
Because of this, the behavior of this axis is dynamic.
histogram
This is the probability distribution of the sample amplitudes. Smooth
plots can be collected over long durations when the decay setting is off or
sample data is pasted. In the record mode the histogram can transform
into a dynamic fast changing display when the decay option is set to small
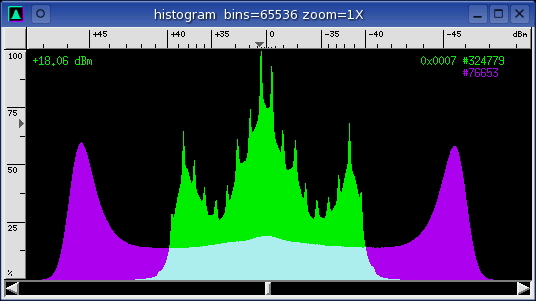
duration values. Stereo or multiple channels will be overlaid or will be
in separate rows depending on the position in the input
channel mapping
window. The example below is stereo data with the two channels overlaid
(green + purple = cyan).
OSD
The on screen display (OSD) shows the
dBm, hexadecimal sample value, and the count of hits for the particular bin
that the mouse is currently pointing to. Pressing and holding down
the first mouse button in the histogram window will popup crosshairs which
will aid in more accurate bin selection. Note that the number of hits
is shown color coded for multiple channels.
scroll bars
The sample amplitude scroll bar is on the bottom and the
percent of hits scroll bar is on the right. They allow moving the
viewport around in the sample amplitude probability domain. Note that
the mouse scroll wheel is attached to the percent scroll bar, Alt+wheel zooms,
and the Shift+wheel switches control to the sample amplitude axis. The
arrow keys navigate and the Alt+arrows zoom as would be expected. The
page up and page down keyboard button scroll up and down in the hit count axis
(%). See the keyboard reference
tables for all of the hotkey shortcuts.
Below is a two channel histogram plot of microphone noise with strong 60 Hz
elements. The jaggy features of the green plot are artifacts from the
ADC.
To see more interesting and insightful histograms check out the
quantization gallery
section of the Full Duplex DAQ comparison application note.
|
|
|
|
|