|
|
|
measurements |
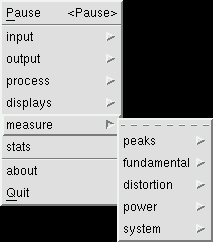 The measurement windows automatically display a wide variety of signal
parameters, internal baudline variables, and calculated statistics.
Their goal is to quickly and accurately report numerical values of things you
might want to measure in baudline. In fact the values they report are far
more accurate than can be measured manually with the mouse. The units
range from Hz, dB, PSD, percent, semitones, RPM, counts, and time.
There are four basic families of measurement windows and they each have their
own unique set of features, constraints, and behaviors. They are:
The window below is peak frequency measurement window of a 2-channel stereo
signal. Note that baudline can handle up to nine channels of signals.

The design philosophy of the measurement windows is for the user to select
a layout -session, configure the baudline
mission settings, choose a couple measurement windows, position them
horizontally or vertically, perform some signal analysis and then exit.
This way many different complex and sophisticated test and measurement
scenarios can be saved for later use.
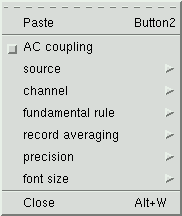
The measurement windows use a shared menu concept. That means options
selected in one window apply to all the measurement windows. Changing
the source, precision, font size, or any of the other options will have an
immediate effect on other windows. This was done to simplify
configuration and make the implementation manageable. Below is a typical
measurement window's popup menu:
Paste
Select and paste a section of sample data into the measurement windows for a
long duration summation while in the Pause mode. This reduces the
variance (error) and results in a more accurate measurement. The paste
operation here is very much like the paste feature in the
Average window.
AC coupling
The AC coupling option removes the DC component
from all spectral based measurements. This is useful when a strong 0 Hz
frequency value is causing improper peak detection or contaminating any
distortion measurements such as THD or ENOB.
 source
Select the spectrum or the
average window as the measurement
source. The Spectrum source is dynamic in that it tracks what is
being recorded, played, or pointed to in the pause mode. The Average
source tracks the current Average bank (F#). Clear the Average bank or
select a different one and the measurement changes. Each source has its
benefits and drawbacks.
 channel
This option selects which channels should be enabled for viewing when the
source is the spectrum mode. The default setting is to view all
channels. The intended use of this menu is to reduce the number of
displayed measurement channels for aesthetic or duplicate reasons.
 record averaging
This option is only valid when the source is set to Spectrum and
baudline is in the Record mode. The selected value represents the number
of slices that should be averaged.
The number of record averaging slices can range from 1 to 5000. The
amount of time this equals is a function of sample rate and
scroll control overlap
setting. A smaller number results in a faster changes and a more
immediate response which is useful for non stationary signals. A larger
setting means a longer average which has the effect of stabilizing the update
jitter (digit spinning). This can make the display more readable and
also improve the accuracy (precision) of the measurement.
This averaging option can be thought of as reducing the measurement variance.


 precision
Use the left and right arrow keys to change the number of precision decimal
places. This control has no effect on internal accuracy. It
simply sets the rounding and truncation decimal position.
Many factors contribute to measurement error such as noise, signal strength,
signal jitter, and floating point numeric effects. Depending on the
situation and signal source, the number of significant decimal digits can vary
from zero to more than six. A good general rule to follow while recording
is that "spinning digits are not valid digits."
There are some operational methods that can be utilized by the user to increase
measurement precision. For example: Reducing the spectral
variance by averaging is a good thing for noisy or weak signals. This is
accomplished either with the Drift Integrator or the Average window. For
strong signals, the Spectrum window source might produce better results than
the Average window source due to numeric accumulation noise.
The
record averaging option mentioned above works good for What works
good for one type of measurement might not be the best approach for a different
type of measurement. Using calibrated test signals (external or internal
Tone Generator loopback) are the best method to use for determining
significant digits.
Note that reducing the spectral variance is different than reducing the
variance of the measurement (see
record averaging option). In the Drift
Integrating while recording case, both forms of averaging can be done at the
same time. This isn't inherently good or bad, it is just an interesting
combination that the user should be aware of.


 font size
Use the up and down arrow keys or the mouse scroll wheel to increase or
decrease the font size. The size of the measurement windows can be made
full width or
larger for easy
viewing from across the room.
|
|
|
|
peaks |
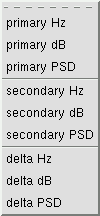 The peaks family consists of primary, secondary, and delta measurements.
Units can be Hz, dB, and PSD. The peak
measurements have all of the popup menu options listed above (source,
channel, record averaging, precision, and font size).
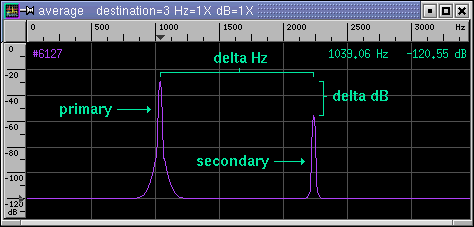


primary (Hz dB PSD)
This is the strongest spectral peak. The dB and the PSD measurements
match the ruler and on-screen-display values which means that they are
calculated directly from the numeric values of the largest transform
bin. The Hz measurement also uses the largest transform bin but it
employs the uHz-rotator algorithm that operates in the complex domain to
calculate an extremely accurate estimate of the frequency. Under good
conditions (strong signal and low noise) the frequency accuracy can exceed 8
significant digits (~.000001 Hz). All of the measurement windows that
work with Hz utilize the uHz-rotator algorithm.


secondary (Hz dB PSD)
This is the second strongest spectral peak. It can be either to the
left or the right of the primary peak.


delta (Hz dB PSD)
This is the difference between the primary and the secondary peaks. The
delta dB measurement works the same as if you manually used the
delta measurement bars. The delta Hz measurement is similar but it uses the uHz-rotator
algorithm for an extremely accurate delta Hz measurement.
|
|
|
|
fundamental |
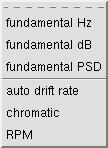 The fundamental family of measurements utilizes a concept of the fundamental
and its harmonics. The fundamental is the first harmonic and the
second, third, fourth, ... harmonics are integer multiples of the fundamental
frequency. See the
harmonic helper bars for more
educational information on harmonics.
 fundamental rule
The fundamental measurements have the same popup menu options that the
peaks measurements have plus this fundamental rule menu option.
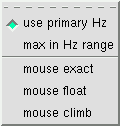
The default option is to use the primary Hz as the fundamental, with
this rule the strongest peak is treated as the fundamental. The max
in Hz range option calculates the strongest peak that is within a bounded
frequency range and uses that as the
fundamental. The multiple mouse options track the frequency value that
the mouse in the Spectrum or Average window is pointing to. The
exact option uses the bin number exactly and is the crudest
setting. The float option is like the exact setting except that it
uses the uHz-rotator algorithm for a more accurate frequency value. The
climb option is like the float option except that it also climbs the
highest adjacent peak. The climb algorithm is the most useful of the
mousing options, just point near the peak and an accurate answer is the result.


fundamental (Hz dB PSD)
Similar to the peaks measurements but different in two significant
ways. The first difference is tracking, the fundamental Hz measurement
is the same as the primary Hz measurement when the fundamental rule is
set to "use primary Hz" but it becomes something else entirely when a different
rule is used. The second difference is that the dB and PSD measurements
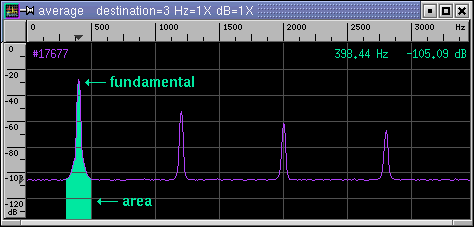
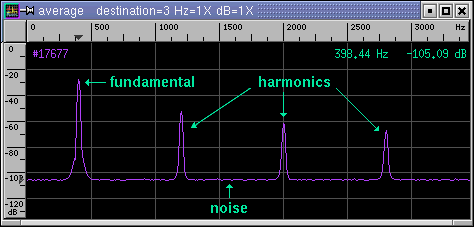
calculate the area under the curve as shown in the average picture above.
A major benefit of the area summation is that it solves the
window leakage problem. Peak
energy is now constant and no longer related to frequency and window function.
For an educational experiment use the Tone Generator with loopback and step or
sweep the frequency. The primary dB measurement will fluctuation
as a function of frequency. The fundamental dB measurement will
remain constant for all frequency values.


auto drift rate
Reports the auto drift rate in
Hz per second. Probe the drift rate of specific bins by changing the
fundamental rule to mouse exact. Useful for measuring
Doppler drift rate. The Drift Integrator's auto drift feature needs to
be enabled for this measurement to work.


chromatic
Display the fundamental frequency in units of the chromatic scale.
Useful for transcription and instrument tuning. The display format is
octave number, semitone note, and cents. There are 100 cents per semitone
and the notes of the chromatic scale are { A Bb B C C# D Eb E F F# G G# }.
Semitones get rounded up or down at the 50 cent value. This
measurement window can be used in conjunction with the
piano keys controller.
 calibration
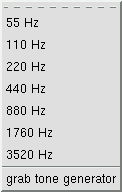
The chromatic measurement window's A2 calibration can set to one of the
several fixed frequency values. Or it can be calibrated to any arbitrary
Hz value with the grab tone generator option which takes the current
main frequency value in the tone generator window and sets A2 to that.


periodicity
Display the fundamental frequency in the units samples of periodicity.
A value of 3 means that some signal characteristic repeats every 3
samples. This measurement window is useful for situations where the
sample rate value isn't appropriate such as with nucleotide or raw binary data
streams.
Formula:
period = sample rate / Hz


RPM
Revolutions per minute. Like a tachometer. Designed to calculate
the rotational rate of many different types of spinning machinery.
Proper configuration of machine parameters must be set for accurate RPM
measurements.
 cycle
cycle
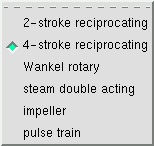
Describe the cycle type of the machine under test.
- 2-stroke reciprocating - internal combustion engine; lawn mowers,
leaf blowers, weed wackers, chainsaws, dirt bikes
- 4-stroke reciprocating - internal combustion engine; automobiles,
motorcycles
- Wankel rotary - internal combustion engine; automobiles
- steam double acting - steam driven train engine
- impeller - propellers, fans, pumps
- pulse train - single pulse; crankshaft sensor, capacitive discharge
 cylinders
The cycle factor. Range from 1 to 24. Units are a function of
cycle type and can be cylinders, rotors, blades, or pulses.
|
|
|
|
distortion |
 Noise and distortion measurements. A subset of the fundamental family of
measurements. Utilizes the
fundamental rule menu option.
The harmonics and noise floor are calculated from the fundamental
frequency, the ratios between these make up the distortion family of
measurements.


SNR
Signal to Noise Ratio where the noise excludes the harmonics. Units are
decibels (dB). Larger SNR equals cleaner signal. When the SNR is
zero dB the amount of signal equals the amount of noise. Negative SNR
can be thought of as how many dB the signal is beneath the noise floor.
There are two interesting limits on the fundamental frequency range:
- When the fundamental is extremely low in frequency all frequencies
greater than the fundamental are considered harmonics. In this case there
is no noise (zero) and the SNR display is +infinity.
- When the fundamental is greater than half the Nyquist frequency the
harmonics are zero and the distortion measurements of SNR and SINAD are equal.
Formula:
SNR = RMS fundamental / RMS (noise excluding harmonics)


THD
Total Harmonic Distortion is a measure of nonlinearity. Noise and
nonlinearity are different things. THD is the ratio of harmonic energy to
fundamental energy. The units are decibels (dB) and percent (%).
A THD of 0 dB is the same as 100% THD.
Smaller THD (more negative) equals a cleaner signal.
Caveats:
- When the fundamental is greater than half the Nyquist frequency the
harmonics are zero and the THD display is -infinity.
- Like with SNR, when the fundamental is extremely low in frequency there
is no noise (zero). This means everything that is not the fundamental is
considered harmonics. When this happens the value of THD is the same as
the SINAD measurement but negative.
- The THD percent measurement is a power ratio where a THD of -20 dB
is 1%. This should not be confused with an amplitude ratio where
a THD of -40 dB is 1%. Both are valid ways of expressing THD as a
percent. Baudline uses the power ratio method. Use the THD dB value
if you wish to reduce any chance of ambiguous interpretation.
Formula:
THD = RMS harmonics / RMS fundamental


SINAD
Signal to Noise and Distortion Ratio where the noise includes the
harmonics. Similar to SNR but the harmonics are treated as part of the
noise. Negative SINAD represents dB below the noise floor.
Interesting note:
- When the fundamental is greater than half the Nyquist frequency the
harmonics are zero and the distortion measurements of SNR and SINAD are equal.
Formula:
SINAD = RMS fundamental / RMS (noise including harmonics)
      = RMS fundamental / RMS (noise + harmonics)
      = 1. / RMS (harmonics / fundamental + noise / fundamental)
      = -RMS (THD - SNR)  where (-) signifies inversion (/)
Leads to these two interesting relationships in dB space:
SINAD = -20. * log10(sqrt(10^(THD/10.) + 10^(-SNR/10.)))

THD+N = -SINAD


ENOB
Effective Number of Bits. Units are bits (see power of two).
Calculated from SINAD. Can be used to describe the quality of an ADC
(analog to digital converter). Noise such as dither reduces the
effective bits of a system. The meaning of negative bits is unknown.
Formula:
ENOB = (SINAD - 20. * log10(sqrt(1.5))) / (20. * log10(2.))
     = (SINAD - 1.7609 dB) / 6.0206 dB


SFDR
Spurious Free Dynamic Range. A ratio of the signal to the strongest non
signal element (spurious peak). Units are dB. Unlike SNR and THD,
harmonic relationships are not required and the second largest peak can be
either to the left or right of the fundamental.
Formula:
SFDR = RMS fundamental / RMS second largest peak
For a further in depth analysis of this topic see the
sine distortion app note.
|
|
|
|
power |
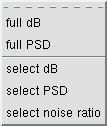 The power family of measurements operate on a bounded contiguous region of
spectral bins. Either all of the spectral bins for the full case, a
user specified range for the select case, or the relationship between the
select and the full measurements for the ratio case.


full (dB PSD)
This measurement is the area summation of all the spectral bins. It is a
total power measurement. Units are dB or volts^2 for the PSD version.
Formula:
full = RMS (fundamental + harmonics + noise)


select (dB PSD)
This measurement is the area summation of a selected
frequency range of spectral bins.
It is a total power measurement. Units are dB or volts^2 for the PSD
version. This measurement will always be equal to or less than the full
power measurement.
Formula:
select = RMS (selected frequency range)


select noise ratio
Select to Full power ratio. Like SNR or SINAD except that the select
(fundamental) is now user definable. Units are in dB. The region
that is within the select zone is considered signal while the region not
in the select zone is considered noise hence the term select noise ratio.
Formula:
ratio = RMS select / RMS (full - select)
      = RMS signal / RMS noise
|
|
|
|
system |
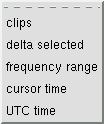 The system family of measurement windows consist of time domain counts like
clips, user selected ranges, and clock time. It is a catch all category
for reporting internal baudline parameters, user settings, and other
measurements that don't fit into the above defined measurement classes.


clips
Also known as over saturation, sample clipping is a cause of harmonic
distortion. The clips measurement window counts the number of samples
that have the value of -32768 or +32767. The more severe the clipping
the higher or faster the count. The Histogram and the Waveform window
can be used to verify or locate the time position of the clipping. This
is a handy window to keep open while recording a live signal source because it
provides fast and accurate statistics.
A section of samples can be selected and pasted into the clips window.
The #count can also be manually cleared from the popup menu.


delta selected
This window displays the delta selected measurement from either the
average,
spectrogram,
spectrum, or
waveform
windows. For spectral measurements the delta units are Hz and dB.
For time measurements the delta units are seconds and (1/seconds) Hz which is
useful for periodicity measurements. A measurement is held on the delta
display until another measurement is done. The measurement can now easily
be written down or used as an on screen reminder. Also if the numeric
precision digits is set at a high value then the
delta selected measurement window will display more significant numeric
digits than the on-screen-displays can report.


frequency range
This window displays the last selected frequency range from either the
average or the
spectrum
windows. The units are in Hz with the upper and lower values representing
the start and end frequencies. The fundamental
and distortion class measurement windows use this
bounded frequency range when the fundamental rule is set to the "max in Hz
range" option. The select power measurements also
use this bounded frequency range as a basis for their summed power
calculations. A range measurement is held until another frequency
selection is done. Note that the
delta selected measurement window calculates and
displays the corresponding (end - start) Hz delta value.
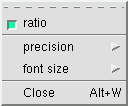 ratio
ratio
The ratio toggle option adds another row to the frequency range
measurement window. The new measurement displayed is the ratio of the end
Hz to the start Hz value. This is a very useful feature for determining
harmonic ratios that are not exact integer values. Pressing the /
(slash) key while the mouse is in the frequency range window flips the
numerator and the denominator for a 1/x effect. The units are "/" and
"\" which indicate ratio and the direction of the division.
Formula:
ratio = end Hz   / start Hz
      = start Hz \ end Hz


cursor time
The format is HH:MM:SS.uuuuuu where HH is hours, MM is minutes, SS is seconds,
and .uuuuuu is microseconds. The time reported is relative time from
the 0 ms position which is at the top for loaded files and the bottom for
recorded signals. The spectrogram and the waveform selector bars are the
source of time position information. So when the mouse is
moved in either window this measurement will reflect that time position.


UTC time
This measurement reports absolute time as either clock time or elapsed time
depending on the particular baudline mode of operation. When used with
the -utc command line option the absolute UTC
time is tracked while in both record and pause modes. When used without
the -utc command line option; recording reports elapsed record duration, and a
mode change to pause grabs the computer's UTC clock time which is used as a
basis of absolute time for the last sample recorded.
The format is YYYY:MM:DD-HH:MM:SS.uuuuuu where YYYY is years, MM is months,
DD is days, HH is hours, MM is minutes, SS is seconds, and .uuuuuu is
microseconds. Pause mode operates like the
cursor time measurement in that the spectrogram and
the waveform selector bars are the source of time position information.
Note that the microseconds value is accurate to the sample interval.
|
|
|
|
|


![]()