|
|
|
Information |
Digital Loopback 16
| vendor |
SigBlips |
| product |
baudline signal analyzer 1.01 |
| interface |
digital loopback |
| duplex |
full |
| channels |
2 |
| resolution |
16 bits |
| max rate |
15+ MSample/sec, CPU limited |
| operating system |
Linux x86_64 2.6.12-1 |
driver |
none |
| test date |
Aug 24 2005 |
| notes |
Enable the tone generator loopback in the Input Devices window.
Set the digital gain in the tone generator to 0 dB.
|
This card is part of the Full Duplex DAQ comparison
survey.
The mission of this digital loopback test is to measure the performance
of baudline's Tone Generator and decimation filters without the analog
influence of a sound card. These measurements define the baseline level
of quality for 16-bit resolution.
|
|
|
|
Sample Rate |
The following table of measurements were made using the
sample rate stability
technique. The base rate column divided by the decimation
column is the sample rate column. Since this is a digital loopback
there is no ADC/DAC clock. The loop error column uses a tone
generator loopback method for a high accuracy measurement of the relative
difference between the ADC and the DAC clocks. This test is a measure
of the tone generator's phase accumulator stability coupled with the
sensitivity of baudline's Hz measurement window. This error can be
corrected and is discussed below.
| base rate |
decimation |
sample rate |
loop error |
| 48000 |
1 |
48000 |
+0.0993 PPM |
| 48000 |
2 |
24000 |
+0.0662 PPM |
| 48000 |
4 |
12000 |
+0.0883 PPM |
| 48000 |
8 |
6000 |
+0.0207 PPM |
| 48000 |
16 |
3000 |
+0.0336 PPM |
| 48000 |
32 |
1500 |
+0.0376 PPM |
| 48000 |
64 |
750 |
+0.0336 PPM |
| 48000 |
128 |
375 |
+0.0431 PPM |
| 48000 |
256 |
187.5 |
+0.0452 PPM |
The loop error has an accuracy of more than 0.1 PPM. In real world
measurements this accuracy can be improved by a couple orders of magnitude if
baudline is run in a dual channel mode. One channel being the analog
loopback signal and the other coming from the digital loopback. Then use
the frequency measured from the digital loopback instead of the frequency
dialed into the tone generator to calculate the PPM error. Think of this
as a runtime calibration that corrects the error of the dialed in tone
generator output.
|
|
|
|
Frequency Domain
|
Baudline was wired up with the Tone Generator
digital loopback in full
duplex fashion. Since this is a digital loopback link and the performance
is independent of sample rate only the base rate of 48000 will be used.
The sample rate will be varied by using baudline's
decimation setting in the
Input Devices window. The following sections show a brief overview of the
channel frequency response and the distortion metrics as a function of
decimation rate.
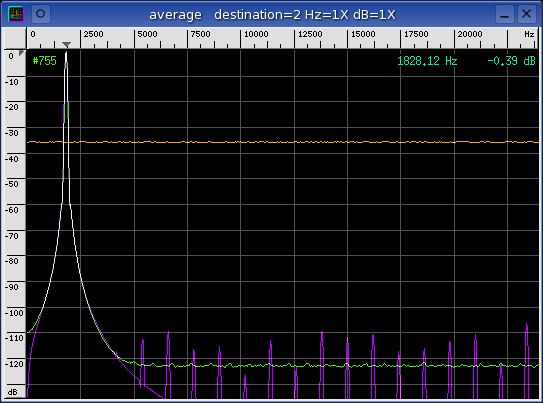
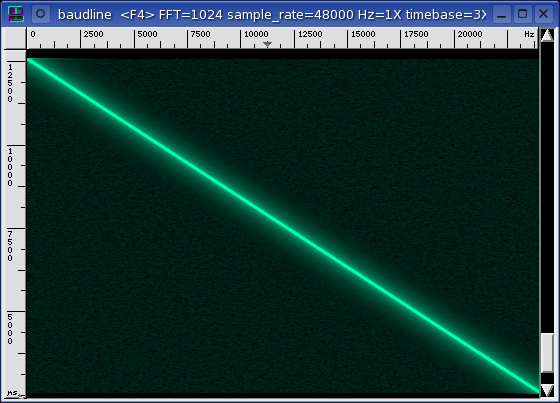
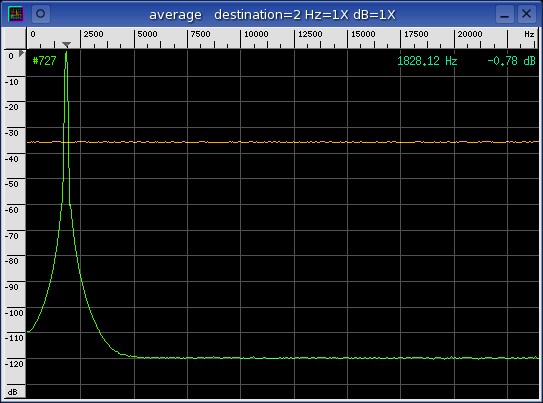
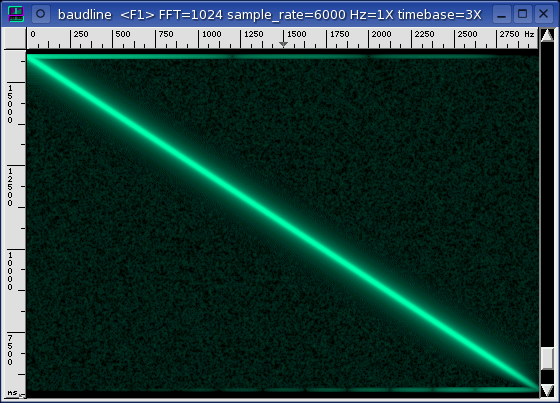
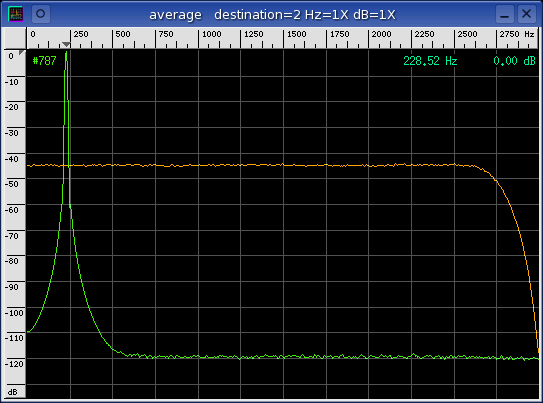
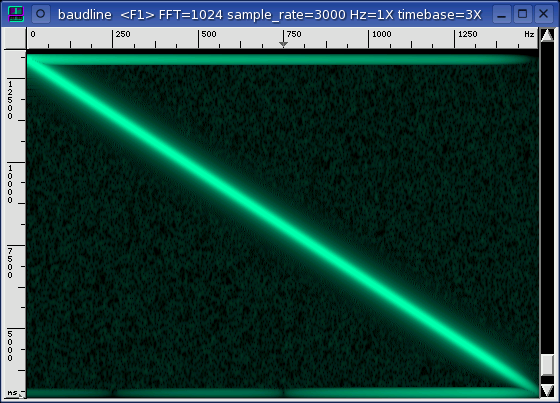
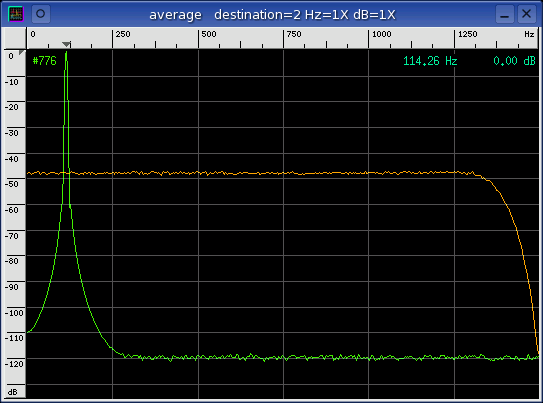
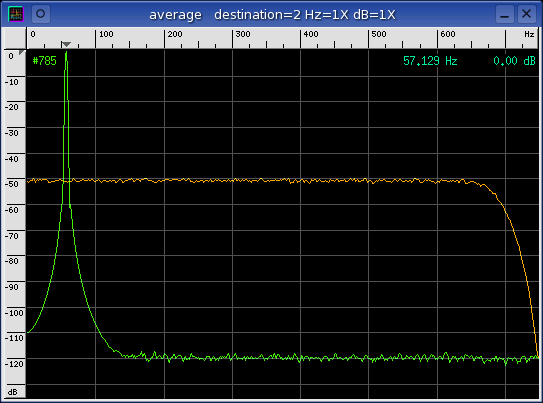
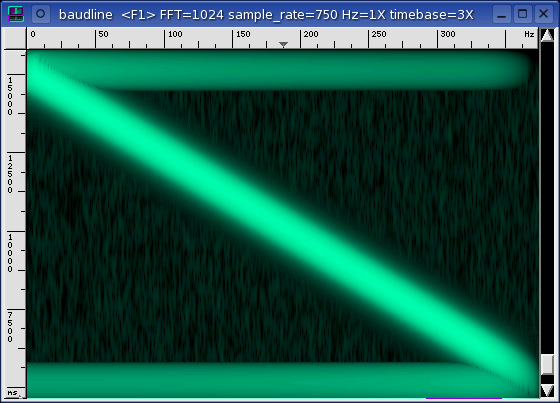
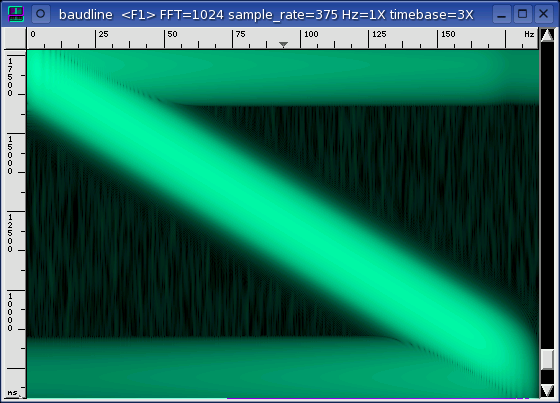
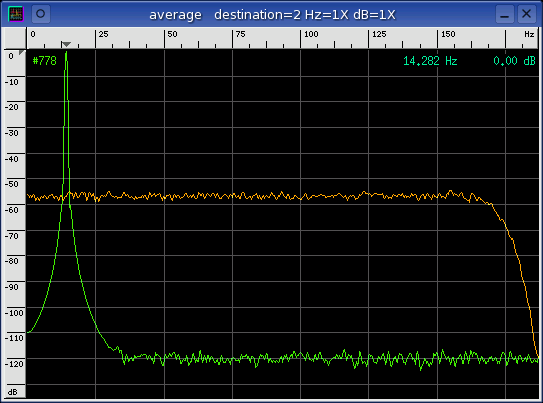
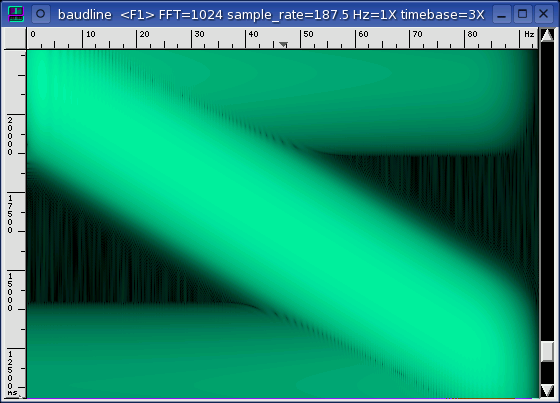
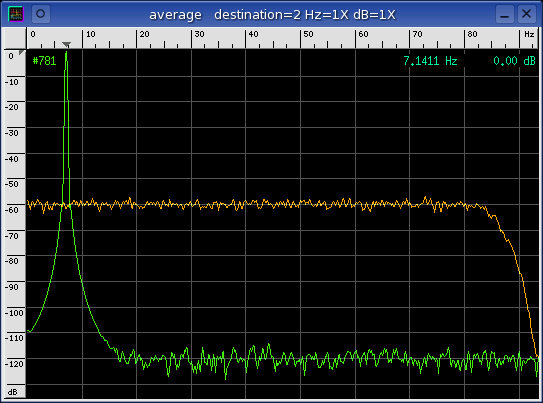
The spectrogram image is of a linear sine sweep that excites all of the
channel's different modes. The orange curve in the Average window is
collected WGN. Both are
an application of the
swept sine vs. WGN technique
and are equivalent measures of the frequency response. The green curve
in the Average window is the loop backed sine wave signal used by the
ENOB window and the other
distortion metrics.
There is no noise floor crosstalk curve for two reasons. First, because
the test signal is mono and the crosstalk measurement requires at least stereo
channels. Second, because digital silence is absolute and the noise floor
response is at -inf dB which is off the bottom of the display..
The purple curve is a 1800.00 Hz sine wave and it shows the effect of having
no dither.
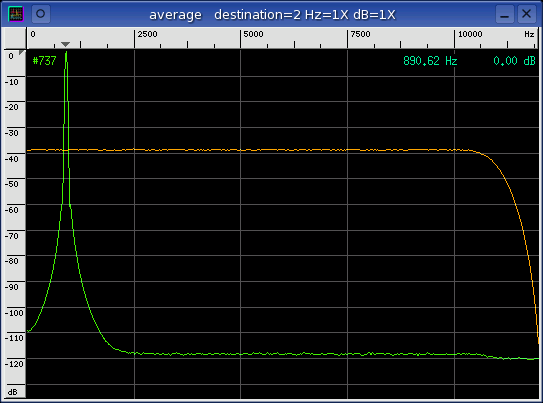
By looking at the above plots a couple interesting observations that relate to
decreasing sample rate can be made.
The spectral lobe width of sine sweep increases as the sample rate is
lowered. This is because the swept duration is 10 seconds for all of the
test runs. This is effectively increasing the sweep speed which widens
the spectral lobe..
The energy of the orange WGN curve drops by 21 dB from the decimate by 2
to the decimate by 256 case. That works out to a 3 dB drop for each
halving of the sample rate. This is also known as decimation gain.
The variance of the Average spectral curves grows as the decimation ratio
increases. This behavior is due the collection duration remaining
constant. A lower sample rate means less samples for a given duration.
distortion
The following table of measurements were made using the technique described in
the sine distortion application
note. It is a full duplex test that uses a loopback of the tone generator
to measure the various distortion parameters.
| rate |
SNR |
THD |
SINAD |
ENOB |
SFDR |
|
| 48000 -nodither |
+99.88 dB |
-106.45 dB |
+99.02 dB |
+16.154 bits |
+115.27 dB |
| 48000 |
+96.91 dB |
-103.54 dB |
+96.06 dB |
+15.662 bits |
+112.73 dB |
| 48000 / 2 |
+95.29 dB |
-102.96 dB |
+94.61 dB |
+15.421 bits |
+111.45 dB |
| 48000 / 4 |
+96.40 dB |
-101.91 dB |
+95.32 dB |
+15.540 bits |
+111.46 dB |
| 48000 / 8 |
+96.44 dB |
-102.51 dB |
+95.48 dB |
+15.567 bits |
+111.44 dB |
| 48000 / 16 |
+96.42 dB |
-104.62 dB |
+95.81 dB |
+15.621 bits |
+113.55 dB |
| 48000 / 32 |
+96.68 dB |
-102.81 dB |
+95.73 dB |
+15.608 bits |
+110.00 dB |
| 48000 / 64 |
+96.66 dB |
-103.93 dB |
+95.61 dB |
+15.638 bits |
+113.42 dB |
| 48000 / 128 |
+96.72 dB |
-103.21 dB |
+95.84 dB |
+15.627 bits |
+109.50 dB |
| 48000 / 256 |
+96.36 dB |
-105.27 dB |
+95.83 dB |
+15.625 bits |
+109.75 dB |
|
|
|
|
Quantization
|
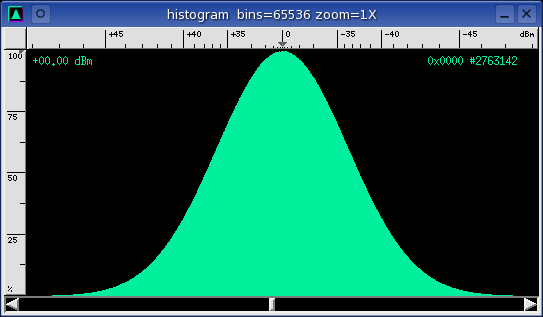
There is no quantization distortion because the loopback is a pure digital
channel. The
Histogram window below
is a perfect example of how a white Gaussian noise distribution is supposed
to look.
|
|
|
|
Analysis |
The sample rate stability loop error slowly improves as the decimation ratio
increases but only by a factor of 2. Theoretically the PPM error should
be improving by a factor of 2 for every doubling of the decimation rate due
to the increase in bin resolution. This isn't happening so other internal
algorithmic numerical noises must be the limiting factor.
The distortion measurements are fairly equal at all of the different decimation
ratios. This validates the correctness of baudline's decimator
algorithm. There is a 0.2 bit drop in ENOB from the decimation off to the
decimate by 2 transition. This ENOB anomaly improves slowly in the
following decimate by 4, 8, and 16 transitions. Not sure what it means
but it could be filter imperfections causing the initial drop and then gradual
rise could be due to internal decimation gain.
The distortion measurements are a couple dB higher and the ENOB is 0.4 bits
greater when dither is disabled. Dither eliminates spectral spurs at
specific frequencies (see purple curve above). So dither is a compromise.
These distortions and errors are extremely minor when compared to the
measurements from a full duplex analog sound card.
|
|
|
|
Conclusion |
A pure digital signal was used as a loopback test source and baudline operated
as expected. There were no obvious flaws, glitches, spurs, or
distortions. This test validates the integrity of baudline as a signal
generator and analyzer.
This test of the digital loopback also creates a baseline of performance that
all of the other sound cards can be compared against.
|
|
|
|
|