We've got signal, but what the heck is it?
That's your mission. Analyze this bébé.
 download the audio file 12.wav.gz
hints :
- No need to gunzip this file since baudline can automatically uncompress
files.
-
Setup baudline to be a Web Browser helper application as described in the
FAQ.
- Ignore the constant 60 Hz tone.
- In the play deck, turn on the 60 Hz notch filter and set the digital gain
boost to +18dB.
-
Try playing the mystery signal at a slower speed such as 0.25X or shift it down
about -12000 Hz.
-
Use the
fundamental Hz
measurement window with the fundamental rule of "max in Hz range" to find the
exact frequency of the steady state tone (to within 1 Hz). A larger FFT
will give you even more accuracy. Type this numeric value and the units
"Hz" into a search engine.
What is it?
It is the sound of a 10 year old 27" Toshiba TV (CRT) being turned on.
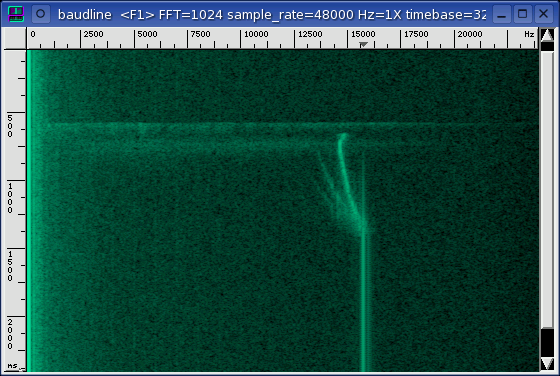
The acoustic emissions consist of three distinct phases; the turn on click,
the warm up sweep, and the steady state retrace frequency of 15734.87 Hz.
The sweep and the retrace tone are created by the flyback transformer in the
TV. The flyback transformer is the high voltage source of the scan line
that draws the image on the TV display.
The mystery signal starts with a broadband click of the TV being turned on.
Next the warm up sweep lasts less than a second. Since this was a warm
start it was quick, a cold start takes much longer and is about 5 to 10
seconds. Interestingly the sweep shape depends greatly on the make and
model of the TV. Some TV's, like the Toshiba, begin about 1 kHz below
the 15.7 kHz retrace frequency and look like an exponential charging of a
capacitor. Other TV's, like a Sony RPTV, begin about 1 kHz too high,
slowly increase another 1 kHz, and then have a linear decay down to 15.7
kHz. So it is believed that this motion isn't a charging up but rather
a stabilization of the flyback transformer and it's support circuitry.
Finally the electronics have stabilized and a constant 15734.87 Hz retrace
frequency is emitted by the flyback transformer. This tone can be
detected from a long distance away and it was measured with baudline's
extremely accurate
fundamental Hz
measurement window. The frequency is related to the horizontal retrace
lines of an NTSC signal. Originally the NTSC signal was defined as 525
(lines) * 30 (FPS) = 15750 Hz. Due to the addition of color coding to the
NTSC specification back in 1951 the 30 FPS rate was changed to 29.97 FPS for
technical reasons. Recalculating; 525 (lines) * 29.97 (FPS) = 15734.25 Hz
which is within 0.62 Hz of the measured value. This 0.004% error is due
to the low tolerances of the sound card's ADC clock. A PAL signal would
have a retrace frequency of 625 (lines) * 25 (FPS) = 15625 Hz.
Also of interest is a secondary lobe at 15972 Hz that is about 21 dB down from
the main retrace frequency. This is a 240 Hz difference which is a
multiple of 60 Hz. The cause of this lobe is unknown, not all TV's emit
this, and it is likely caused by some nonlinearity in the high voltage
system. This artifact can be further explored by zooming into the
frequency domain with a larger FFT (see picture below) and/or by zooming into
the time domain by using a smaller FFT with a narrower windowing function such
as a high beta Gaussian window.
|