We've got signal, but what the heck is it?
That's your mission. Analyze this bébé.
 download the audio file 8.wav.gz
hints :
- No need to gunzip this file since baudline can automatically uncompress
files.
-
Setup baudline to be a Web Browser helper application as described in the
FAQ.
-
Turn on the 60 Hz notch filter in the play deck.
-
Try playing the mystery signal at different speeds, slow it down or drop it
an octave.
-
Use baudline's
harmonic helper bars
to determine harmonic relationships.
-
Use the
delta measurement bars
to measure pitch change.
-
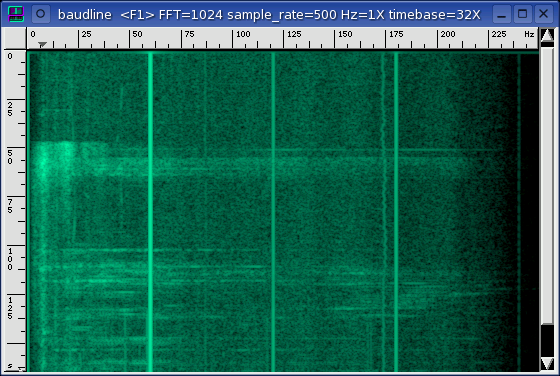
Ignore the wiggly tone at 173 Hz, it is fan noise that leaked in.
What is it?
About 4.9 on the Richter scale. This is the signal of the Gilroy
Earthquake of 13 May 2002 that was captured by baudline, a sound card, and an
inexpensive microphone. The time was 22:00 and baudline was doing it's
usual 24x7x365 capturing of everything bass when this mild earthquake
hit. The file begins with 45 seconds of silence, then the ground shook,
the house shook, the walls shook, and this created sound that the microphone
recorded. Let us break it down:
There are two noise peaks at 8 Hz and 19 Hz that are not harmonically
related. The low frequency noise of the earthquake energized the
structure modes of the house (also known as resonance frequencies).
Noticeable shaking lasted for about 35 seconds at which time the 19 Hz frequency
decayed away. The 8 Hz noise peak decayed at a slightly lower rate but it
remained clearly measurable about +18 dB above the noise floor for more than
2 minutes. Why did the 19 Hz peak decay away faster than the 8 Hz
peak? The damping coefficient of the house is smaller for lower
frequencies.
By measuring the time of arrival between the P and the S waves the distance
to the epicenter can be calculated. The P-wave hits first at about 45
seconds into the file, then if you look closely at the 40Hz+ noise burst in the
spectrogram you can see the S-wave hitting about 8 seconds later.
Multiply the (S - P) delta by the factor 8 km/s for a rough estimate of
distance. This calculation estimates the epicenter distance to be 64 km
away. The actual Cupertino to Gilroy distance is 61 km.
formula: distance = (S - P) * 8 km/sec
If you would like to learn more try the following external links:
|