|
|
|
Gallery |
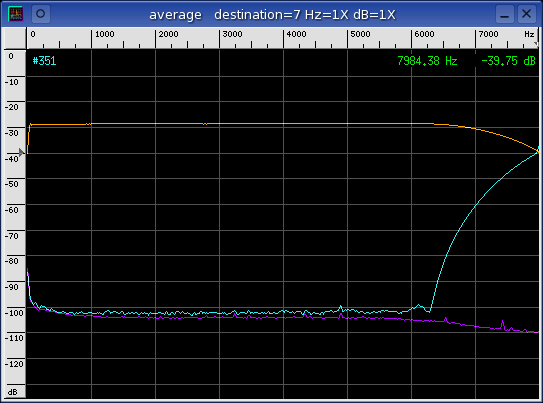
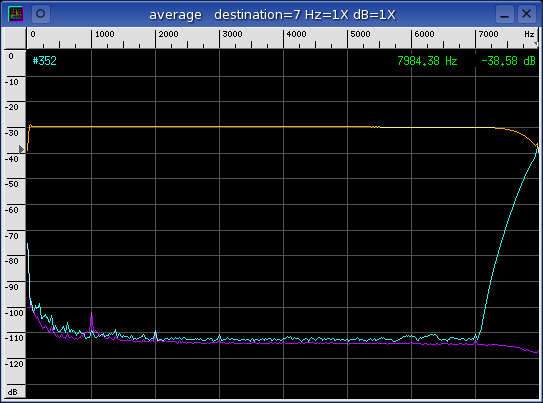
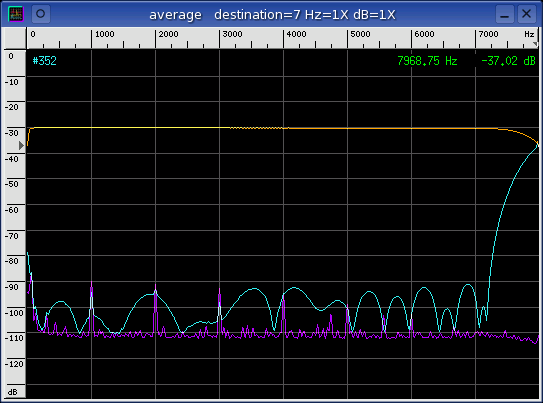
ADC filter response at 16000
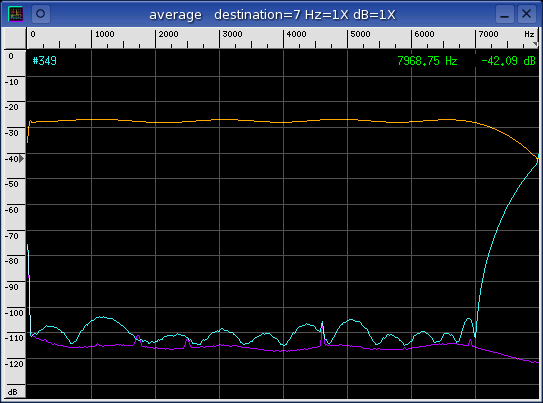
The ADC filter response is
important when acquiring sample data from an audio device. It determines
the flatness of the frequency pass-band and the amount of aliasing
distortion. The quality of a device's
LPF and sample rate converter can
be summarized in a single spectrum image.
The methods used to create the spectral plots below are described in the
Swept Sine vs. WGN application
note. The orange curve represents the pass-band frequency response which
from 0 Hz (DC) to the
Nyquist frequency. The
cyan curve is folded frequency which represent alias rejection past the Nyquist
point. The purple curve is the noise floor. The occasional green
curve is a pure sine wave that is used for distortion measurements.
This gallery is part of the Full Duplex DAQ comparison
survey.
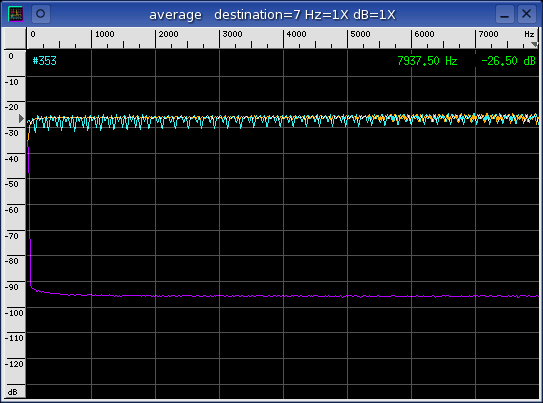
Some devices such as the VIA 8235, SiS 7012, and the ESS Maestro 2E have
nonexistent anti-alias filters (flat folded cyan curves). Both the VIA and
the SiS products use a Realtek codec but it is not sure that the decimation
stage is being processed there..
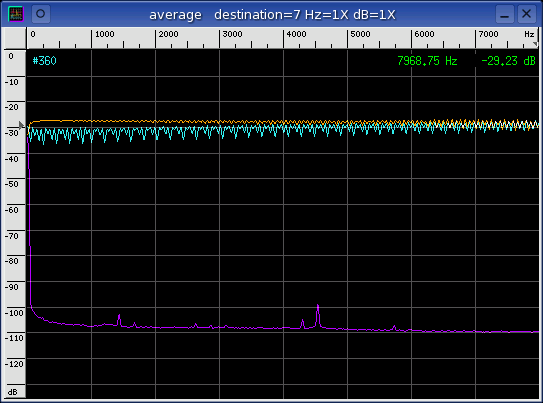
The Sound Blaster 16 PCI and 128 which are both based on Creative's ES1371
chipset have identical looking spectral plots. The folded cyan curves
show fairly shallow anti-alias roll off.
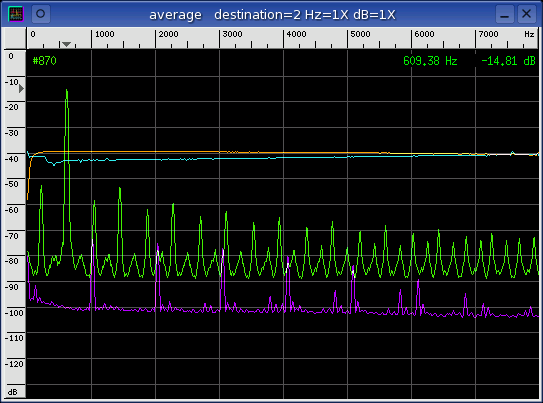
The Sound Blaster Live! and both revisions of the Griffin iMic have very sharp
anti-alias roll offs. The two iMics have the most attenuation (-80 dB
with v0.06) and the sharpest roll off (v3.00).
Out of the above bunch of cards, the only ones recommended to record at the
16000 sample rate are the CS4236B, SB Vibra16X, SB Live!, and both iMics.
|
|
|
|
|