|
|
|
Information |
  Griffin iMic v3.00
| vendor |
Griffin Technology
|
| product |
iMic v3.00
|
| interface |
USB 1.1 |
| duplex |
full |
| channels |
2 |
| resolution |
16 bits |
| max rate |
48 Ksample/sec |
| codec |
Philips UDA1325H
|
| operating system |
Mandrake 9.0 Linux x86 2.4.19 |
driver |
usb-audio OSS 3.8.2 |
buffer size |
input 128 KB, output 128 KB |
| test date |
Sep 23 2005 |
| notes |
The iMic v3.00 is not usable with either Fedora core3 or Ubuntu 5.04 because
the ALSA USB audio driver locks up in a matter of minutes.
The iMic has poor EMF shielding and is literally "microphonic."
Physically tapping the device causes bass impulses on the line level
inputs. Avoid placement near AC power lines since the iMic is very
susceptible to 60 Hz bleed in.
Vendor=077d ProdID=0223 Rev=3.00
|
This card is part of the Full Duplex DAQ comparison
survey.
|
|
|
|
Sample Rate |
The sample rate on DAQ cards is not a fixed absolute constant. Like time,
it fluctuates, and it is difficult to measure accurately. Sometimes there
are relationships between the input and output sample rates that can reveal
interesting details about the inner working machinery.
The following table of measurements use a technique described in the
sample rate stability application
note. The rate column is the sample rate value that the collection
hardware is programmed to. The in/out rate and in/out error
columns are absolute measurements of the ADC / DAC clock. The
loop error column uses a tone generator loopback method for a high
accuracy measurement of the relative difference between the ADC and the DAC
clocks. The three error
PPM columns are theoretically
related by the formula: "in_error - out_error = loop_error"
| rate |
in rate |
out rate |
in error |
out error |
loop error |
| 4000 |
|
|
|
|
|
| 5510 |
5512.785 |
5511.091 |
+505.445 PPM |
+198.004 PPM |
+321.184 PPM |
| 8000 |
8000.414 |
8001.535 |
+51.7500 PPM |
+191.875 PPM |
-130.707 PPM |
| 11025 |
11025.57 |
11027.12 |
+51.7007 PPM |
+192.290 PPM |
-132.979 PPM |
| 12000 |
12000.61 |
12002.25 |
+50.8333 PPM |
+187.500 PPM |
-130.857 PPM |
| 16000 |
16000.79 |
16003.06 |
+49.3750 PPM |
+191.250 PPM |
-130.901 PPM |
| 22050 |
22051.10 |
22054.14 |
+49.8866 PPM |
+187.755 PPM |
-130.271 PPM |
| 24000 |
24001.19 |
24004.61 |
+49.5833 PPM |
+192.083 PPM |
-130.949 PPM |
| 32000 |
32001.60 |
32006.04 |
+50.0000 PPM |
+188.750 PPM |
-130.962 PPM |
| 44100 |
44102.24 |
44108.13 |
+50.7937 PPM |
+184.354 PPM |
-130.270 PPM |
| 48000 |
48002.45 |
48008.97 |
+51.0417 PPM |
+186.875 PPM |
-130.653 PPM |
The theoretical "in_error - out_error = loop_error" formula is true for all
of the same rates. All sample rates except for 5510 have a -131 PPM
loop error measurement. This machine was not
NTP disciplined so the absolute
rates could have the typical system clock drift. The relative values, on
the other hand, can be trusted to a high degree of accuracy.
Note that the 4000 sample rate was not operational with the iMic v3.00 device.
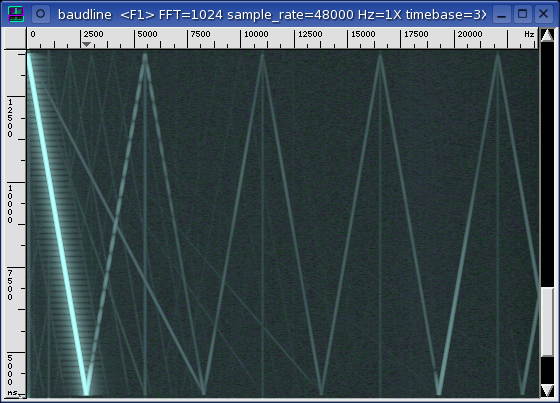
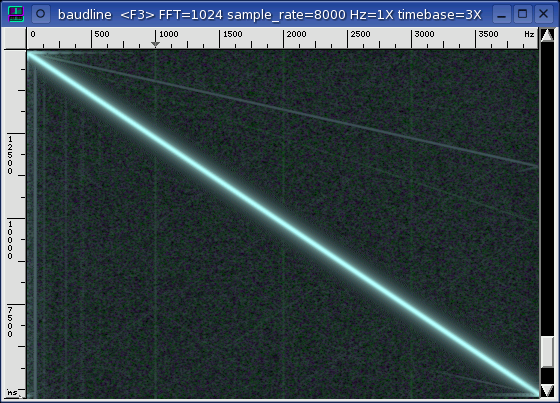
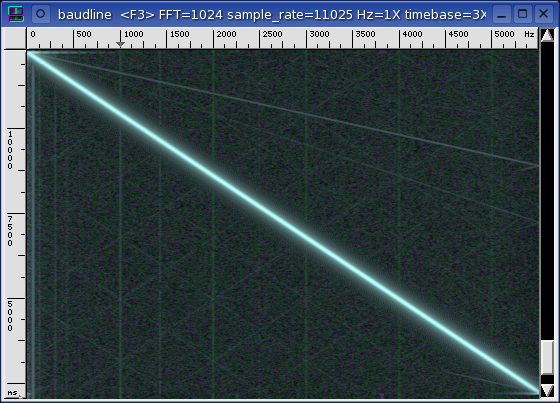
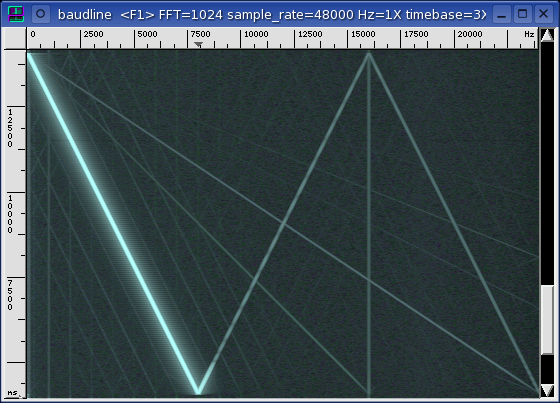
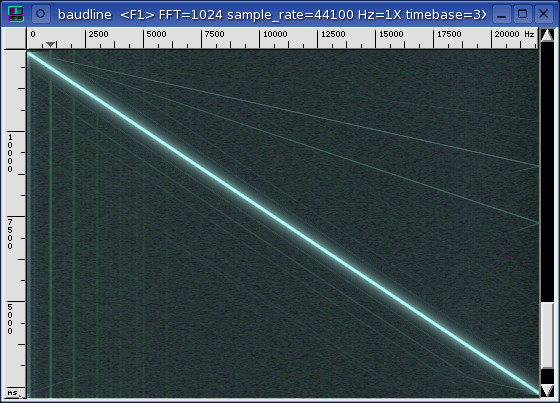
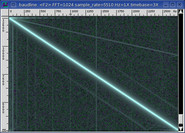
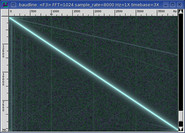
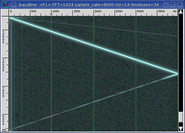
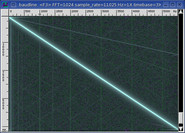
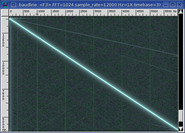
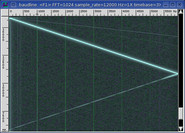
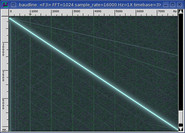
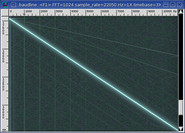
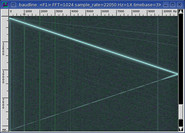
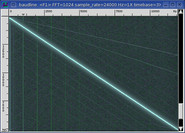
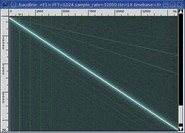
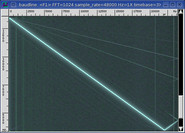
The -debugrate command line option was used to create the sample rate estimate
plot shown below.
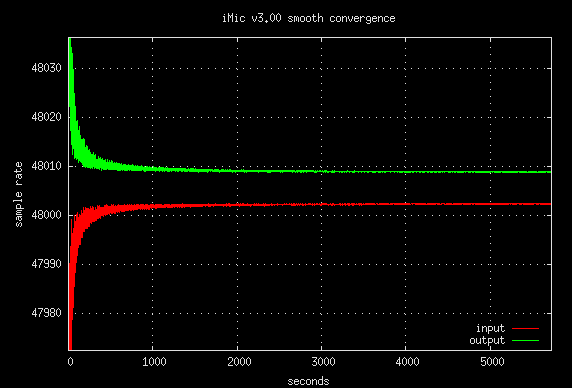
This smooth looking convergence has the output approach inverted. Usually
both the input and output paths have an upward convergence decay. The
reason for this flipped abnormality with the iMic v3.00 sample rate data could
have to do with the 2.4 kernel and/or the older OSS audio drivers.
The delta between the input and output channels matches the -131 PPM
loop error measurement. The stability of the rate tracking curves
signify that the ADC and DAC are operating at different sample rates and that
some other dropping mechanism is not at work.
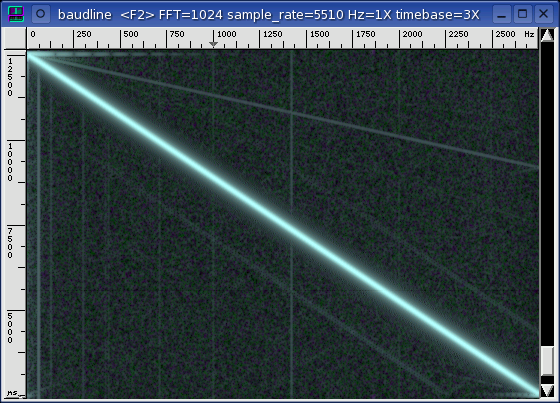
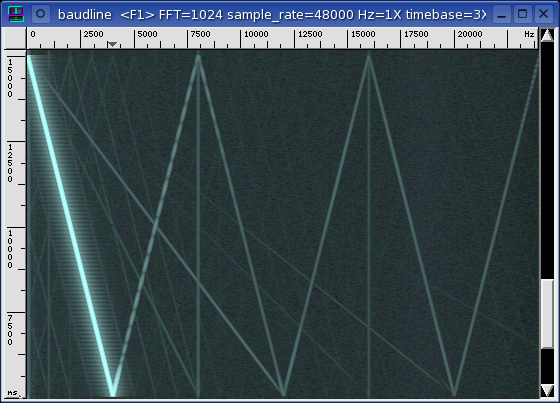
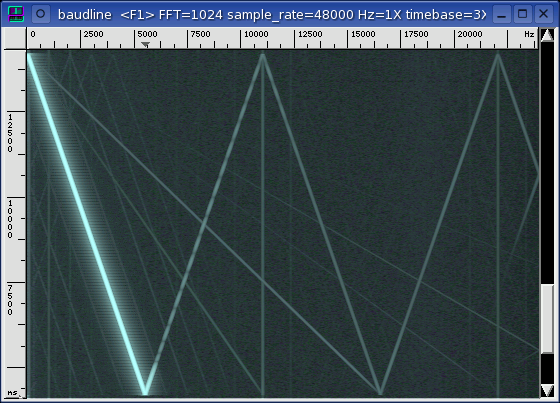
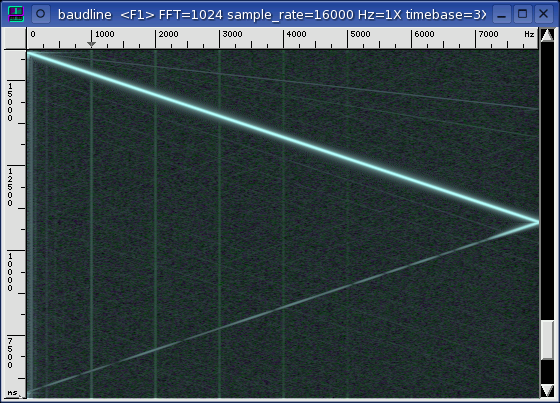
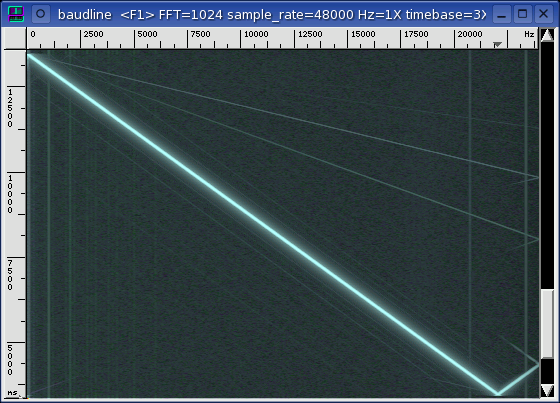
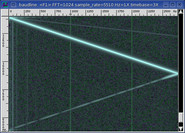
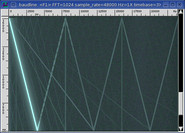
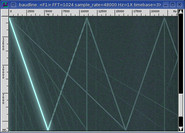
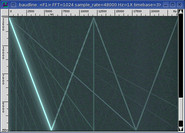
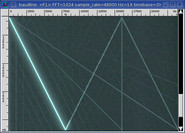
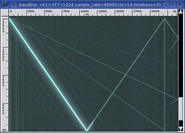
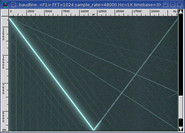
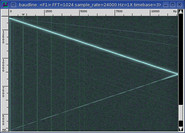
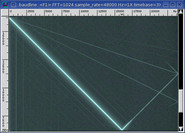
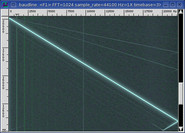
All of the sample rates except 5510 share a similar looking smooth convergence
plot. There is something special about the 5510 rate and it's -debugrate
sample rate plot is shown below.
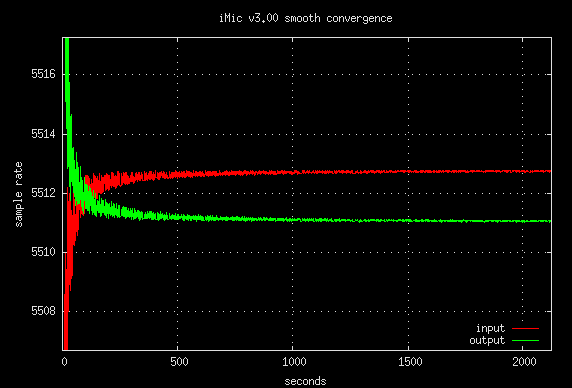
The 5510 rate has the same inverted convergence plot but the added caveat of
the input and output paths crossing over. It is interesting that the 5512
rate is directly in between the input and output curves.
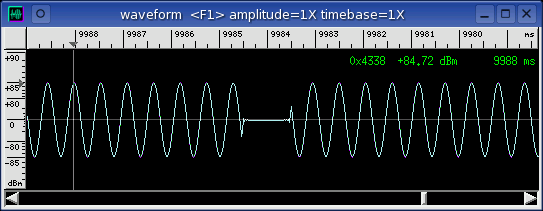
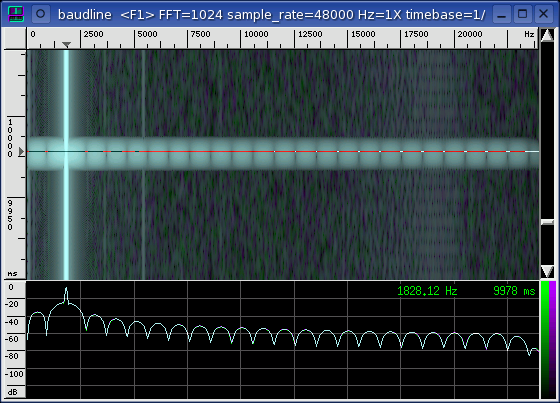
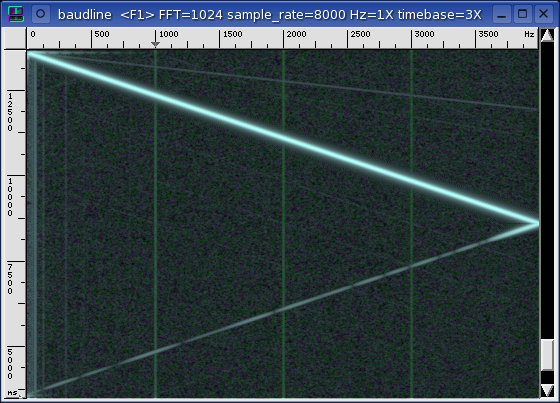
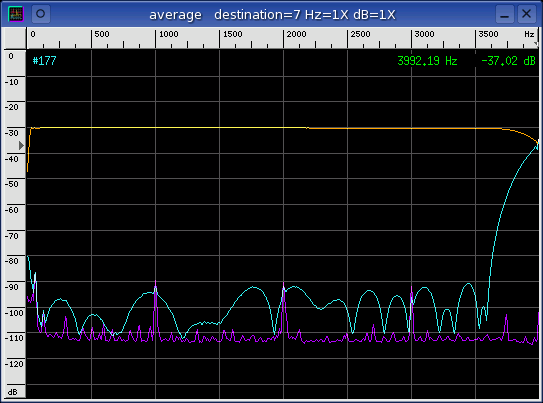
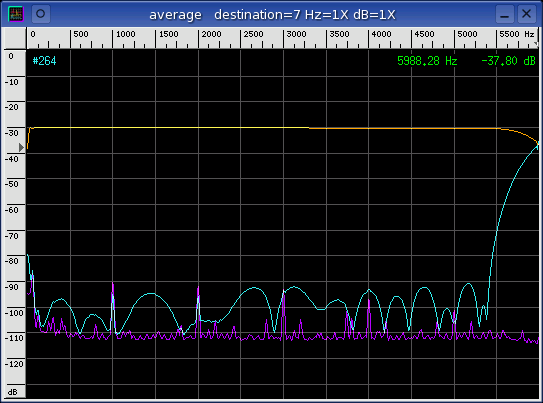
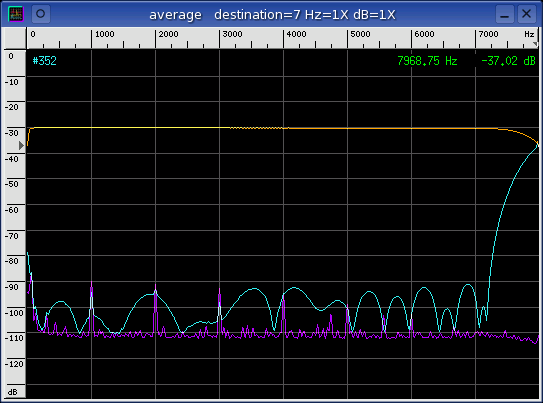
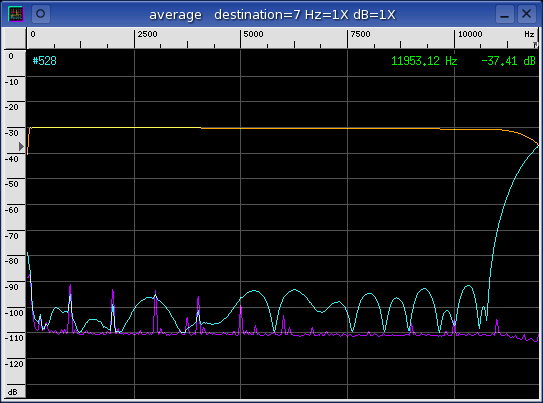
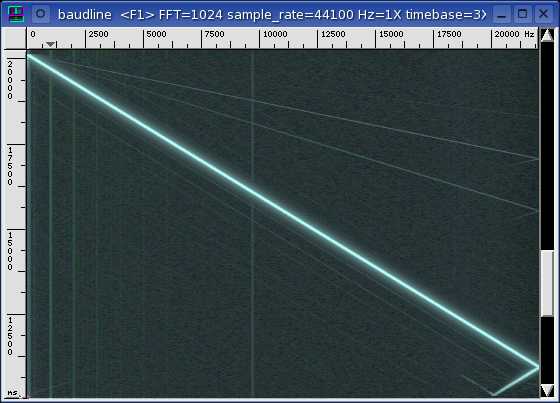
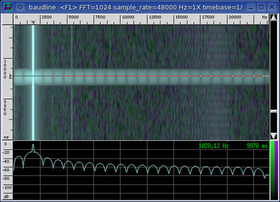
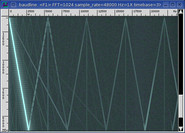
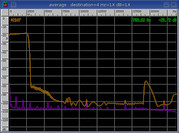
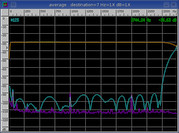
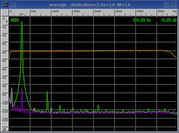
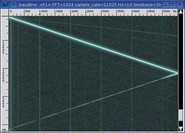
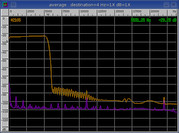
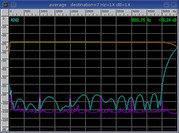
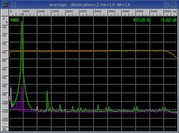
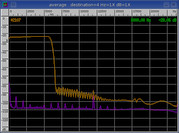
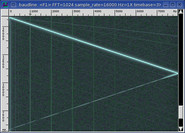
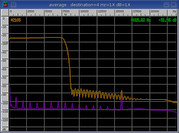
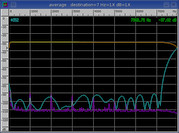
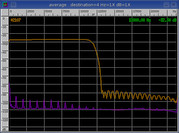
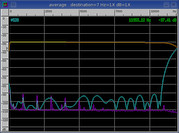
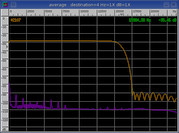
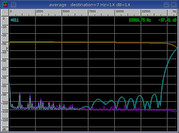
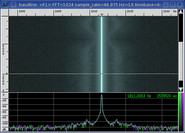
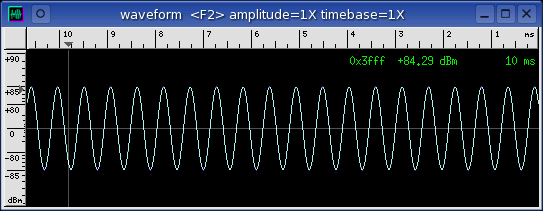
The 48000 rate, and to a lesser extent the 44100 rate, exhibit random spectral
glitches that occur every couple minutes. Below is an example of what the wideband spectral glitch looks like.
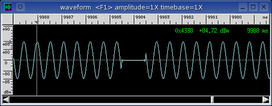
The waveform display shows a 1 ms zero filled gap with standard RC
attack-decay. The zero gap is always one millisecond and this duration
is independent of sample rate. The zero gap has a slight
DC offset that is different than
the DC offset of the noise floor. The combination of the RC ringing and
the DC offset suggests that this sampling flaw is occurring on the DAC output
side.
|
|
|
|
Frequency Domain
|
The sound card's input and output jacks are connected with a short external
cable and run in full duplex mode. This is a loopback test and baudline's
tone generator is the signal source. Distortion, noise floor, filter
response, and inter channel crosstalk are the frequency domain measurements of
interest in this section.
The signal test sources are a pure sine wave, a linear sine sweep, and
WGN. The sine wave is
used for the distortions and crosstalk measurements. The linear sine
sweep and WGN are used for the filter characterization measurement.
Both are an application of the
swept sine vs. WGN technique
and are equivalent measures of the frequency response.
Since spectral performance is a function of sample rate, each of the sound
card's native rates will be tested. The highest sample rate is usually
the cleanest and this is advantageous because it allows the isolated testing
of the ADC and the
DAC. The matched,
source, and sink sample rate combinations are described below.
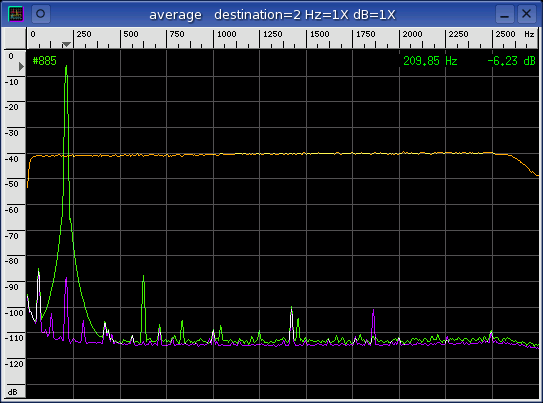
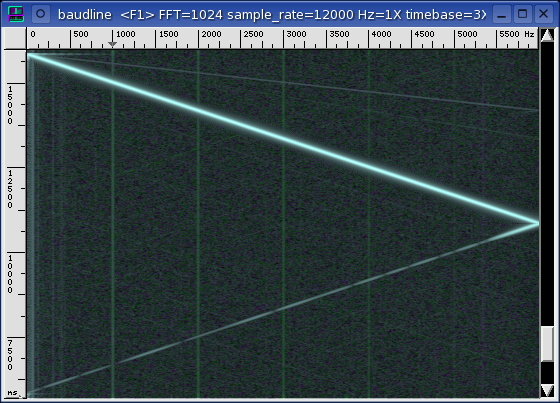
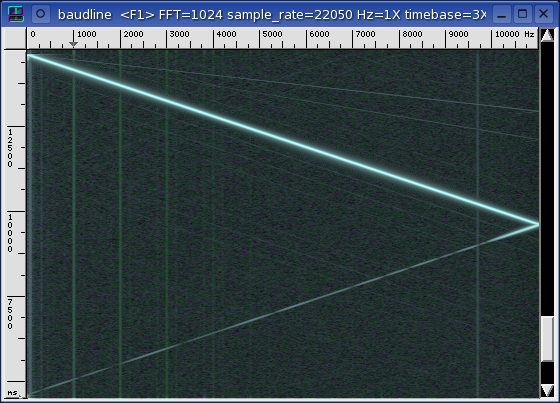
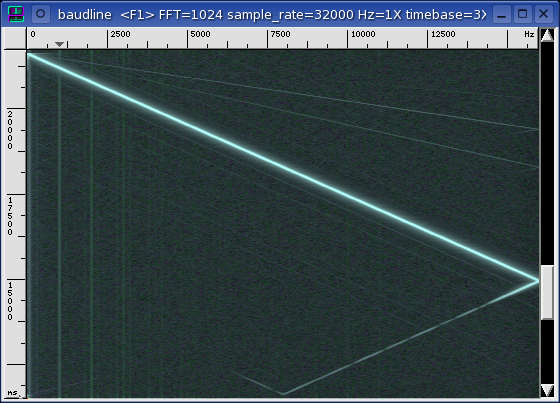
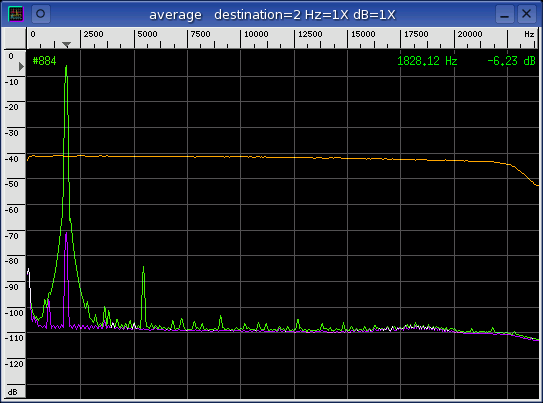
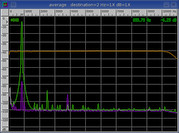
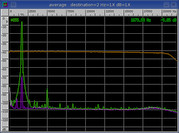
matched
The input and output sample rates are the same. This combination tests
the performance of both the ADC and the DAC in a matched mode of
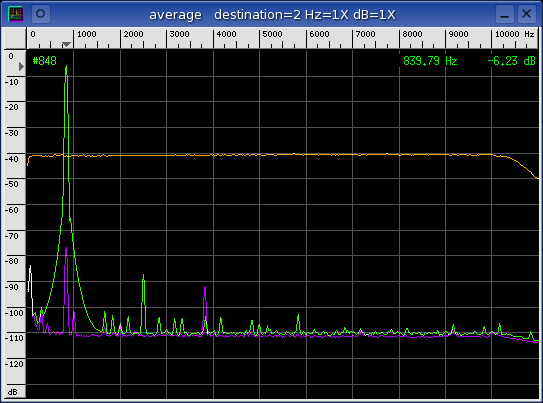
operation. The linear sine sweep signal in the left spectrogram display
and the WGN (orange) in the Average window characterize the in-band filter
response. The sine wave (green) in the Average window is used for
distortion and crosstalk measurements. The sine leakage (purple) is used
for crosstalk measurement
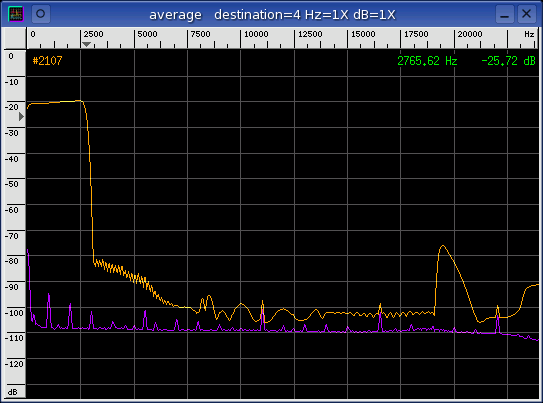
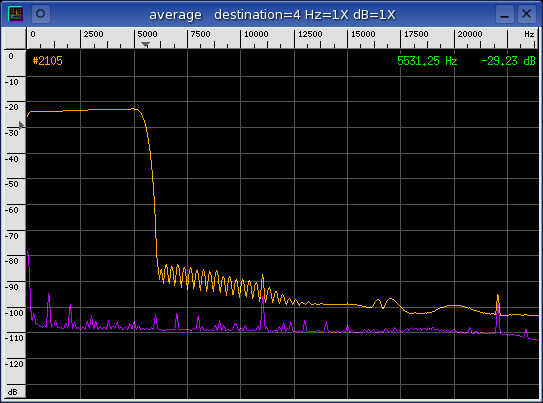
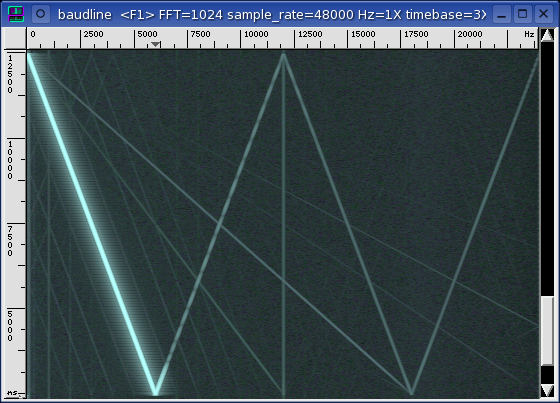
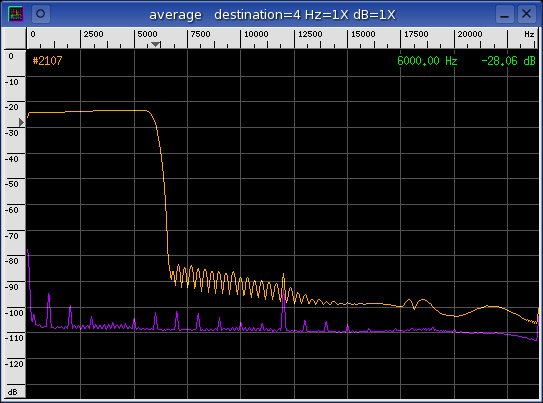
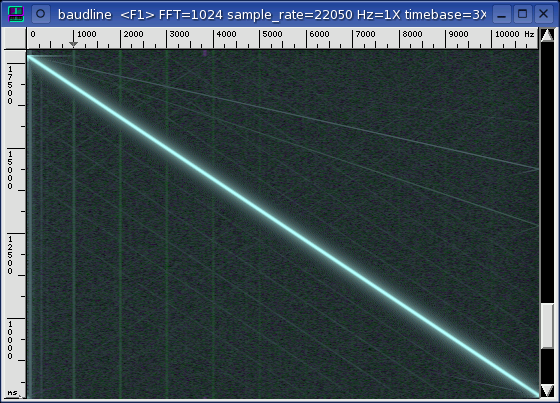
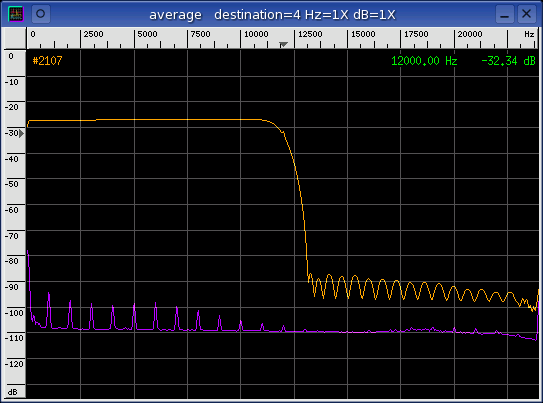
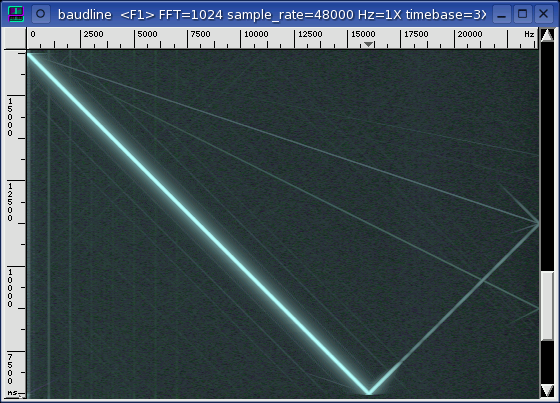
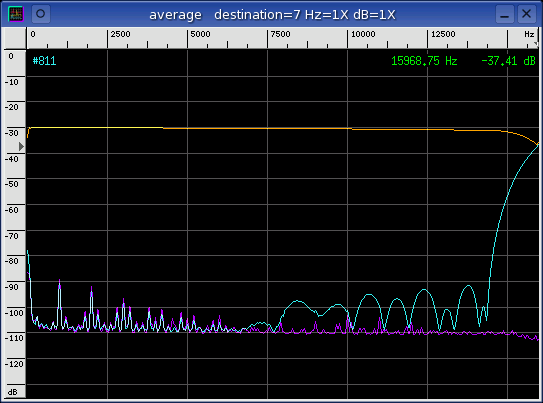
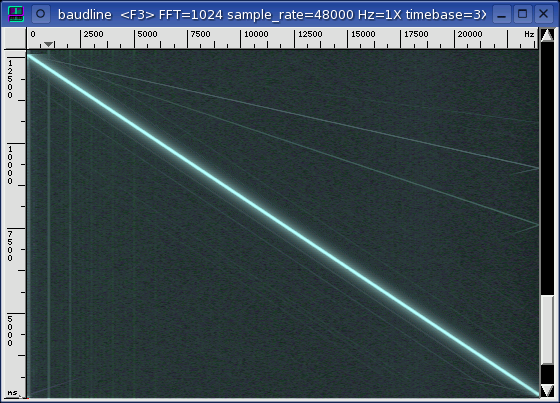
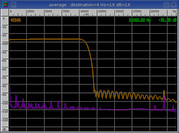
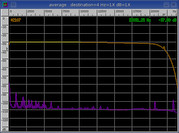
source
The sample rate of the input (sink) is the card's highest clean rate.
This combination tests the performance of the DAC. The linear sine sweep
signal in the middle spectrogram display characterizes the DAC filter
response. The position of the pass-band and the stop-band filter
transition is defined by the Nyquist frequency of the DAC. The noise
floor (purple) is the Average collection of a silent channel.
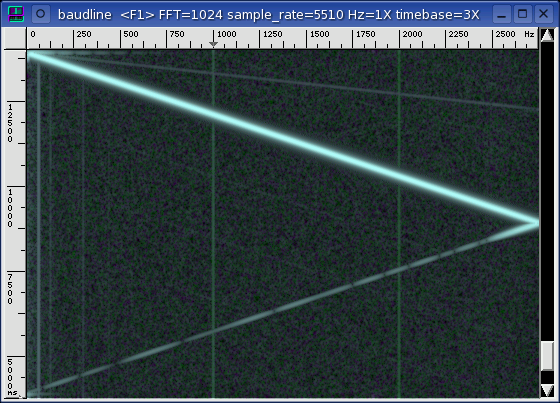
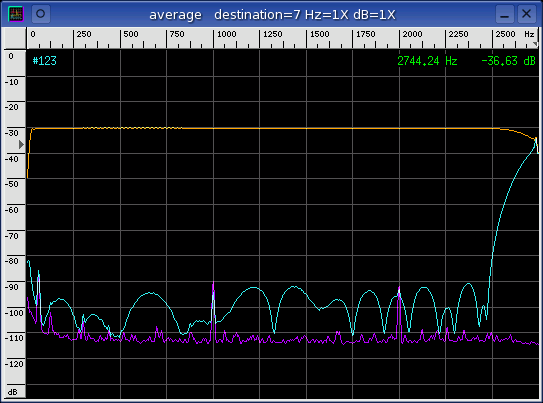
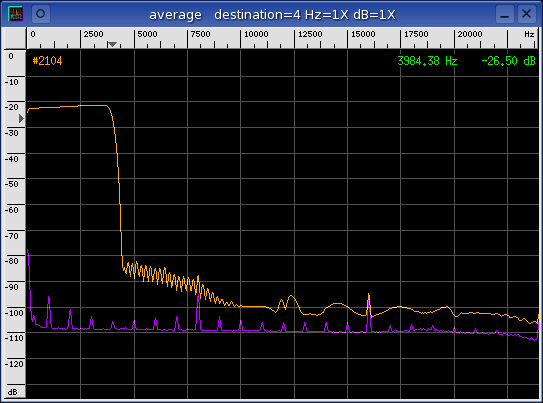
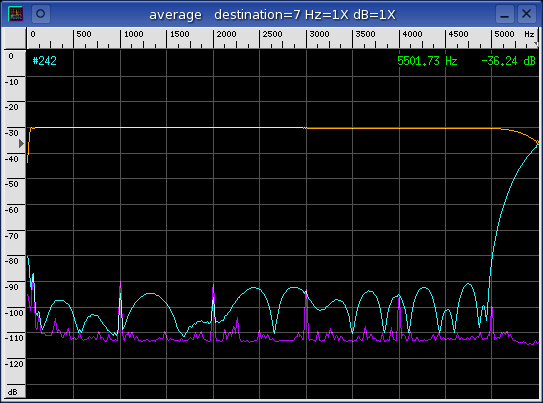
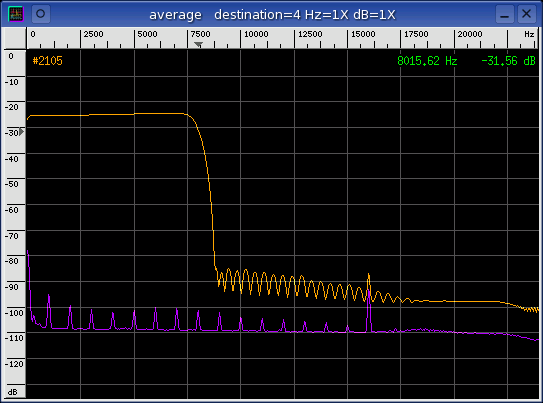
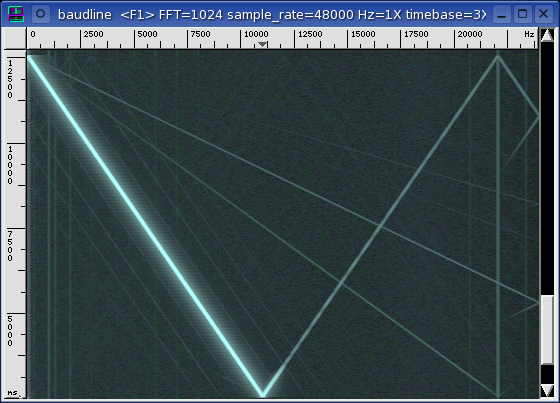
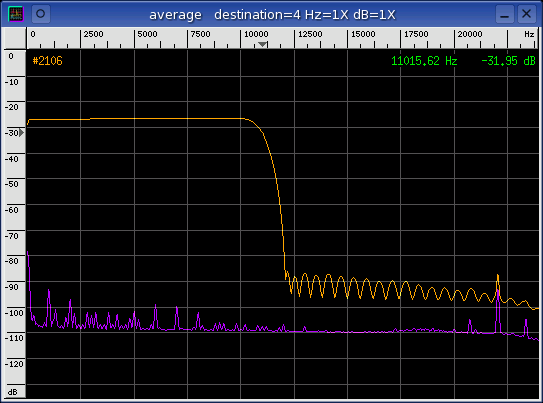
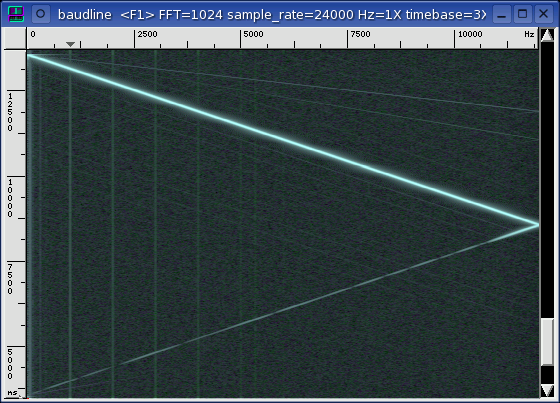
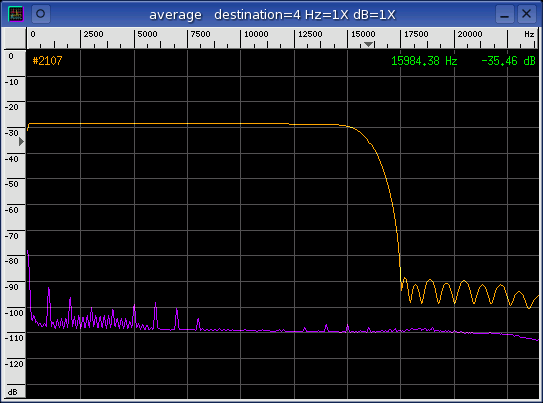
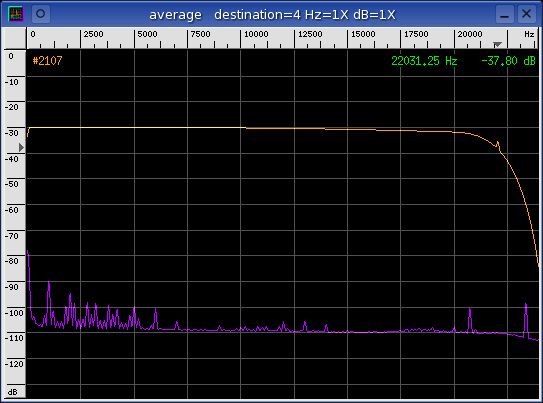
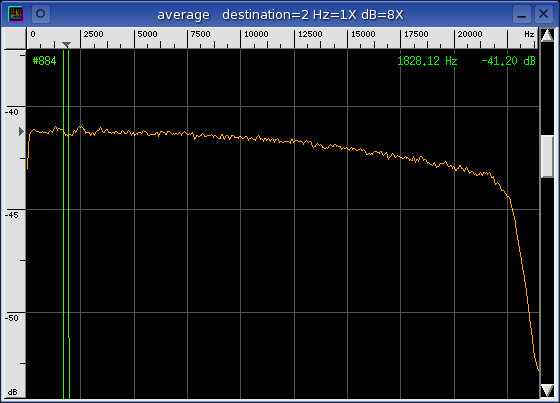
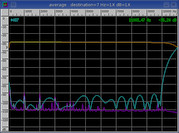
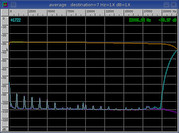
sink
The sample rate of the output (source) is the card's highest clean rate.
This combination tests the performance of the ADC. The linear sine sweep
signal in the rightmost spectrogram display and the orange curve in the Average
window below it characterize the ADC filter response. The position of
both the pass-band and the stop-band filter transition is defined by time in
the spectrogram and by folded frequency in the Average window. The orange Average curve represents the pass-band while the cyan curve is a folded
representation of the stop-band ADC filter response. The noise floor
(purple) is the Average collection of a silent channel.
The naming convention for the columns below is (DAC -> ADC) where DAC
represents the source sample rate and ADC represents the sink sample
rate.
matched
|
source (DAC)
|
sink (ADC)
|
|
5510 -> 5510
|
5510 -> 48000
|
48000 -> 5510
|
|
|
|
|
|
|
|
8000 -> 8000
|
8000 -> 48000
|
48000 -> 8000
|
|
|
|
|
|
|
|
11025 -> 11025
|
11025 -> 48000
|
48000 -> 11025
|
|
|
|
|
|
|
|
12000 -> 12000
|
12000 -> 48000
|
48000 -> 12000
|
|
|
|
|
|
|
|
16000 -> 16000
|
16000 -> 48000
|
48000 -> 16000
|
|
|
|
|
|
|
|
22050 -> 22050
|
22050 -> 48000
|
48000 -> 22050
|
|
|
|
|
|
|
|
24000 -> 24000
|
24000 -> 48000
|
48000 -> 24000
|
|
|
|

|
|
|
|
32000 -> 32000
|
32000 -> 48000
|
48000 -> 32000
|
|
|

|
|
|
|
|
44100 -> 44100
|
44100 -> 48000
|
48000 -> 44100
|

|
|
|
|
|
|
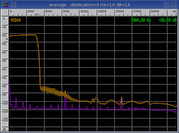
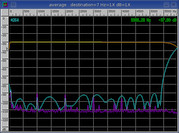
The ADC and DAC filters both have sharp roll-offs with about -60 dB of
attenuation. The source DAC filters at 32000 look like scaled versions
from the previous sample rate. The sink ADC filters have identical
stop-band shapes at all sample rates 24000 and lower which is very unusual.
Also of interest is that the passband for the source column has a slight
negative slope at the 22050 sample rate and below. This coupled with the
above observation suggest a crude low tap interpolation by 2 filter is used.
A 1000 Hz tone plus it's harmonics can be seen in the noise floor of the source
and sink column Average spectrum plots. This is signal contaminates all
the sample rates and it is believed to be an artifact from the internal DSP
engine. Another interesting spectrogram artifact seen at the 22050 rate
and below is a strong vertical tone at twice the Nyquist frequency.
distortion
The following table of measurements were made using the technique described in
the sine distortion application
note. It is a full duplex test that uses a loopback of the tone generator
to measure the various distortion parameters. The stereo crosstalk
column is a measure of channel leakage that uses a sine wave channel and a
silent channel as the signal sources.
| rate |
SNR |
THD |
SINAD |
ENOB |
SFDR |
crosstalk |
|
| 4000 |
|
|
|
|
|
|
| 5510 |
+78.15 dB |
-81.53 dB |
+76.51 dB |
+12.415 bits |
+79.36 dB |
-80.58 dB |
| 8000 |
+77.40 dB |
-81.65 dB |
+76.01 dB |
+12.333 bits |
+78.47 dB |
-79.02 dB |
| 11025 |
+77.83 dB |
-81.43 dB |
+76.25 dB |
+12.373 bits |
+79.26 dB |
-76.39 dB |
| 12000 |
+76.722 dB |
-81.138 dB |
+75.38 dB |
+12.228 bits |
+78.01 dB |
-75.61 dB |
| 16000 |
+76.20 dB |
-80.80 dB |
+74.91 dB |
+12.150 bits |
+77.52 dB |
-73.31 dB |
| 22050 |
+76.21 dB |
-80.43 dB |
+74.82 dB |
+12.135 bits |
+77.95 dB |
-70.74 dB |
| 24000 |
+75.39 dB |
-80.17 dB |
+74.14 dB |
+12.022 bits |
+76.77 dB |
-70.08 dB |
| 32000 |
+79.97 dB |
-79.51 dB |
+76.72 dB |
+12.451 bits |
+80.77 dB |
-67.88 dB |
| 44100 |
+78.95 dB |
-78.05 dB |
+75.47 dB |
+12.242 bits |
+79.31 dB |
-65.37 dB |
| 48000 |
+79.18 dB |
-77.60 dB |
+75.31 dB |
+12.216 bits |
+78.74 dB |
-64.76 dB |
| 48000 / 1024 |
+79.57 dB |
-inf.00 dB |
+79.57 dB |
+12.924 bits |
+90.46 dB |
-64.71 dB |
The performance is average and the distortion measurements are fairly constant
at all of the sample rates. The crosstalk measurement is poor and it
could be related to the sensitivity of the iMic's "microphonic" nature.
deep zoom
The deep spectral zoom concept was used to discover some strange behavior with
the iMic v0.06 so it is being used again here for comparison purposes.
The iMic v3.00 had none of the loop error instability problems that the
iMic v0.06 had so this should be educational.
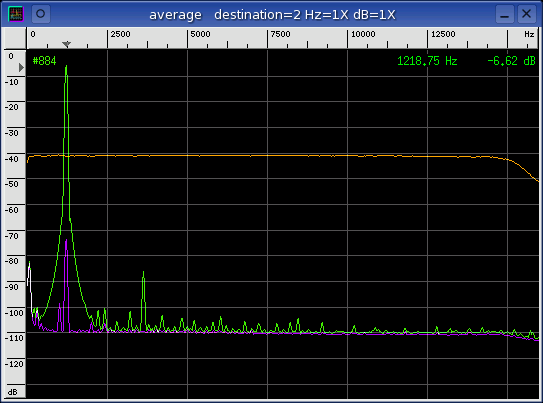
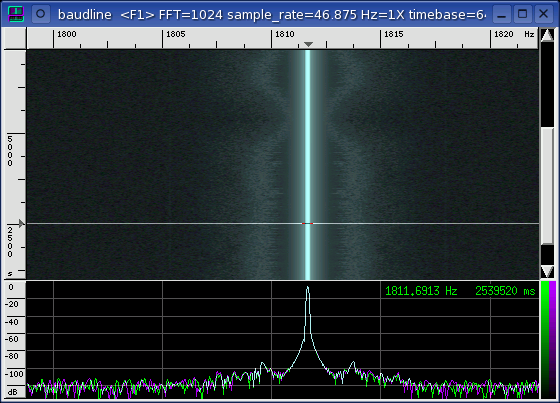
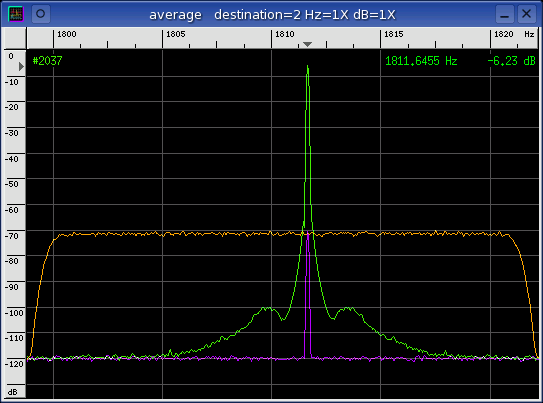
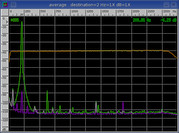
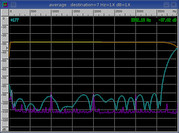
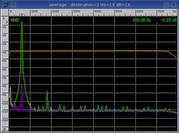
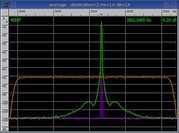
The down mixer feature in
the Input Devices window is used to perform a deep zoom into the frequency
domain. This DDC
increases the frequency resolution and allows the observation of finely spaced
spectral details. The sample rate is 48000 with a 1024 decimation ratio
for an effective 46.875 sample rate. The 1024 decimation factor translates
to the frequency resolution of an equivalent 1M point FFT. Below
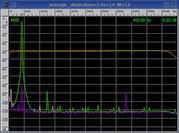
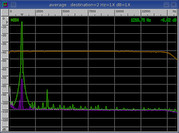
are the standard sine wave, WGN, and crosstalk spectrum plots.
|
48000 / 512
|
|
|
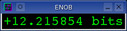
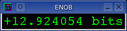
The two modulation lobes left and right of the main tone are offset by about
1.5 Hz. This amount of deep spectral zoom usually increases the ENOB by
significantly more than 1 bit but the existence of the modulation lobes lowers
this improvement to only 0.8 bits. This deep spectral zoom is somewhat
clean and none of the problems that were seen with the iMic v0.06 are
present.
|
|
|
|
Quantization |
A white Gaussian noise signal source was generated and captured in full
duplex loopback fashion at each of the standard sample rates. The
Histogram plots below
show a unique sample distribution that is dependent on sample rate.
4000 ... 48000
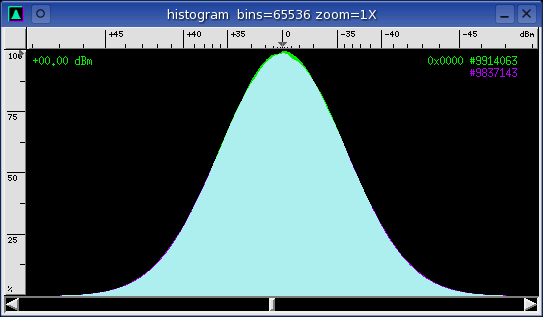
All sample rates have nice clean Gaussian shaped histogram curves.
|
|
|
|
Channel Delay |
A sine wave signal was generated and captured in full duplex loopback
mode. The time domain response was observed with the
Waveform window where
the green curve represents the left channel and the purple curve represents
the right channel.
Zero sample inter channel delay at all sample rates.
|
|
|
|
Analysis |
The only global analysis correlation that can be made is that the 5510 rate
had an odd loop error PPM measurement and it has an odd source DAC
filter shape.
It is interesting to compare the iMic v3.00 filter shapes with those of the
iMic v0.06. Both USB devices use
different revisions of the same Philips codec chip. The filter shapes
are mostly the same but the 0.06 version has about 15 - 20 dB more of
attenuation which results in slightly better distortion measurements.
|
|
|
|
Conclusion |
The iMic v3.00 has good ADC / DAC filters like it's iMic v0.06
predecessor. Some of the old flaws have been fixed while some new ones
have been added (filter attenuation for example).
Other than the occasional zero gap spectral glitch at the 48000 and 44100
sample rates the performance of the iMic v3.00 is fairly good. The
unusual -131 PPM loop error being the only exception. If absolute
or full duplex sample rate error is important then it is best to avoid the 5510
rate.
|
|
|
|
|